
Market Update · 18 min read
New-Home Sales Were 684,000. The Average Price Fell 8.8%.
Census and HUD’s August 2026 new-home sales release, CB26-155, put sales of new single-family houses at a seasonally adjusted annual rate of 684,000. That is 6.4 percent above the revised July rate of 643,000, and the 90 percent confidence interval on that move includes zero. For-sale inventory was 483,000 houses, an 8.5-month supply. The median price was $393,700. The average price was $478,700, 8.8 percent below August 2025, and that average-price drop is the change whose interval stays below zero.

Census and HUD’s August new-home sales release — CB26-155, published September 24, 2026, at 10:00 a.m. Eastern — put sales of new single-family houses at a seasonally adjusted annual rate of 684,000. That is 6.4 percent (±19.5 percent) above the revised July rate of 643,000, and 2.0 percent (±15.7 percent) below the August 2025 rate of 698,000. Census marked both of those national sales moves with an asterisk. The 90 percent confidence interval includes zero, so the Bureau does not have enough evidence to say the actual change was different from zero.
The inventory line is quieter. The seasonally adjusted estimate of new houses for sale at the end of August was 483,000, the same figure Census printed for revised July. Months’ supply was 8.5 at the current sales rate, down from 9.0 in July and level with August 2025. Those supply moves also carry asterisks.
The price line is where one comparison clears the interval. The median sales price of new houses sold in August was $393,700. The average sales price was $478,700. The average is 8.8 percent (±7.7 percent) below the August 2025 average of $525,100. That interval does not include zero. The median’s year-ago comparison, 5.8 percent (±8.2 percent) below $417,900, still does.
This file is August new-home sales. Housing starts are the separate Census construction release. A sale in this survey is a deposit taken or a sales agreement signed. It can happen before a building permit is issued. The August construction file, CB26-147, counts starts, permits, and completions. Read them as two clocks from the same two agencies.
This is a national sales briefing for Florida buyers, sellers, and owners. It sits next to the September 24 Freddie Mac survey at 7.03%, the September 17 survey at 6.95%, the September 16 FOMC hike, NAR’s already-published August existing-home sales, and the Citrus people-and-schools briefing. A national sales pace does not produce a Citrus absorption count. For local process, keep the Florida markets page, the Florida home buying guide, and the Citrus, Hernando, Pasco, Hillsborough, and Pinellas overviews in the same reading list.
The official August scoreboard
From the joint release and Table 1a, seasonally adjusted:
- Houses sold: 684,000 annual rate. July revised 643,000. August 2025 698,000.
- Houses for sale: 483,000. July 483,000. August 2025 493,000.
- Months’ supply: 8.5. July 9.0. August 2025 8.5.
- Median sales price: $393,700. July $392,200. August 2025 $417,900.
- Average sales price: $478,700. July $526,400. August 2025 $525,100.
August is marked preliminary. May, June, and July are marked revised. Census says the preliminary seasonally adjusted estimate of total sales is revised about 6.7 percent on average, because the survey is a sample and because a contract can be signed before the permit that puts the house into the sample. Treat 684,000 as the first official August print, with that revision habit attached.

The not-seasonally-adjusted count for the month itself was 57,000 houses sold. August 2025 was also 57,000. The seasonally adjusted rates differ — 684,000 versus 698,000 — because the seasonal factor differs. A reader who hears “sales rose 6.4 percent” and a reader who counts the raw August closings-and-contracts at 57,000 are both looking at this release. They are looking at two columns.
What the confidence interval allows
Census’s explanatory note is the rule for every percent in this release. A statement such as “2.5 percent (±3.2 percent) above” means the likely range, at 90 percent confidence and for sampling error only, runs from 0.7 percent below to 5.7 percent above. If that range contains zero, the change is not statistically significant. If it does not, the change is. The asterisk in the text is the Bureau’s mark for a range that contains zero.
On the national sales rate, the monthly range runs from about 13.1 percent below July to about 25.9 percent above it. The year-ago range runs from about 17.7 percent below August 2025 to about 13.7 percent above it. Both ranges contain a decline and a gain. The printed 6.4 percent increase is the point estimate. It is not, on Census’s own test, a settled increase.
Three comparisons in Table 1a do stay on one side of zero.
- Midwest sales, month to month: 98,000, up 84.9 percent (±51.2 percent) from revised July 53,000. The range stays above zero. The average relative standard error on Midwest sales for the latest six months is 17 percent, and the base is small. A large percent on 53,000 houses is still a small region.
- West sales, year to year: 112,000, down 26.8 percent (±22.9 percent) from August 2025’s 153,000. The range stays below zero, from about 49.7 percent lower to about 3.9 percent lower. The month-to-month West move, 15.2 percent (±25.7 percent) below July’s 132,000, includes zero.
- Average sales price, year to year: $478,700, down 8.8 percent (±7.7 percent) from $525,100. The range stays below zero, from about 16.5 percent lower to about 1.1 percent lower.
The South, which is the region that contains Florida, did not clear either test. South sales were 451,000, 6.9 percent (±27.7 percent) above July’s 422,000 and 3.4 percent (±23.1 percent) above August 2025’s 436,000. Both intervals include zero. The Northeast was 23,000, 36.1 percent (±36.9 percent) below July’s 36,000. That interval includes zero as well. The average relative standard error is 8 percent on the U.S. sales rate, 10 percent on the South, 15 percent on the West, and 33 percent on the Northeast.
Census also says it takes four months to establish a trend for new houses sold, and that seasonally adjusted changes often move irregularly. The last four months on Table 1a are May 636,000, June 672,000, July 643,000, and August 684,000. That is the window the Bureau’s own note asks for. It is not a straight line.
Inventory stayed at 483,000
For-sale inventory is the stock. Sales are the flow. At the end of August the stock was 483,000, seasonally adjusted, identical to the revised July estimate and 2.0 percent (±4.0 percent) below August 2025’s 493,000. Census’s text calls the monthly comparison “virtually unchanged.” The year-ago interval includes zero.
Months’ supply is the ratio of houses for sale to houses sold. At the August sales rate it was 8.5 months. That is 5.6 percent (±17.2 percent) below July’s 9.0 and, in Census’s words, virtually unchanged from August 2025’s 8.5. The monthly interval includes zero. A lower printed supply can be a faster sales rate, a smaller stock, or both. Here the stock did not move. The sales rate’s point estimate did. Because that sales move did not clear its own interval, the supply move did not either.
The 2026 seasonally adjusted stock, month by month on Table 1a, has sat in a narrow band: January 477,000, February 486,000, March 479,000, April 483,000, May 487,000, June 480,000, July 483,000, August 483,000. The sales rate has moved more than the stock. August’s 8.5 months is the lowest months’-supply print of those eight months. January was 9.9. June was 8.6. The August figure matches the year-ago month.
Not seasonally adjusted, houses for sale at the end of August were 487,000, against 490,000 in July and 496,000 in August 2025. The not-seasonally-adjusted months’ supply was also 8.5, against 9.3 in July and 8.7 in August 2025.
Where those 483,000 houses are in the build
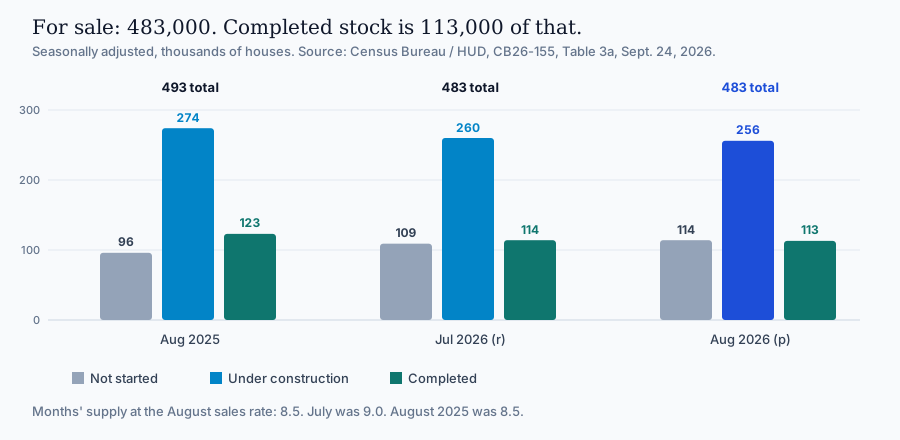
Table 3a splits the seasonally adjusted stock by stage. At the end of August:
- Not started: 114,000, against 109,000 in July and 96,000 in August 2025.
- Under construction: 256,000, against 260,000 in July and 274,000 in August 2025.
- Completed: 113,000, against 114,000 in July and 123,000 in August 2025.
Completed homes are 113,000 of the 483,000 for sale. Under-construction homes are the largest slice, at 256,000. The not-started stock is larger than it was a year earlier. The completed stock is smaller. Census does not print a separate confidence interval on each of those stage changes. The levels are the official figures. The average relative standard error on the for-sale total is 3 percent.
The sales side of the same table, seasonally adjusted annual rates for August:
- Sold, not started: 83,000, against 66,000 in July and 61,000 in August 2025.
- Sold, under construction: 248,000, against 201,000 in July and 218,000 in August 2025.
- Sold, completed: 353,000, against 376,000 in July and 419,000 in August 2025.
Completed houses are still the largest piece of the sales rate, and that piece is lower than July and lower than a year earlier on the printed figures. Contracts on houses not yet started, and on houses still under construction, are higher on the printed figures. A buyer standing in a finished house and a buyer signing on a lot with a plan are both inside this 684,000. The table says which slice is which.
Not seasonally adjusted, the median number of months for sale since completion was 3.2 in August, the same as July, and up from 2.4 in August 2025. The 2025 annual figure was 2.8. The 2024 annual figure was 2.6. That median is months on the market after the house is finished. It is a different statistic from the 8.5 months of supply, which is the ratio of the whole for-sale stock to the sales rate.
The average price is the comparison that cleared
The median is the middle sale. The average is pulled by the expensive tail. In August the median was $393,700, 0.4 percent (±7.4 percent) above July’s $392,200 and 5.8 percent (±8.2 percent) below August 2025’s $417,900. Both median intervals include zero.
The average was $478,700, 9.1 percent (±11.2 percent) below July’s $526,400 and 8.8 percent (±7.7 percent) below August 2025’s $525,100. The month-to-month average drop includes zero. The year-ago average drop does not. July’s average and August 2025’s average were close to each other, at $526,400 and $525,100. August 2026’s average is the one that printed lower, and the year-ago test is the one Census’s interval supports.
Census’s note on prices is specific. Changes in sales price reflect changes in the mix — region, size, and the rest — and changes in the prices of houses with the same characteristics. Table 2 is the mix the release actually prints. It is not seasonally adjusted, and houses with no reported price are spread in proportion to the houses that have one.
August’s 57,000 sales, by price band, in thousands of houses, and the percent of the month:
- Under $300,000: 13,000, 22 percent. July was 10,000 and 19 percent. August 2025 was 10,000 and 18 percent.
- $300,000 to $399,999: 17,000, 30 percent. July 18,000 and 34 percent. August 2025 16,000 and 28 percent.
- $400,000 to $499,999: 12,000, 22 percent. July 9,000 and 18 percent. August 2025 11,000 and 19 percent.
- $500,000 to $599,999: 5,000, 9 percent. July 5,000 and 9 percent. August 2025 7,000 and 13 percent.
- $600,000 to $799,999: 6,000, 10 percent. July 6,000 and 12 percent. August 2025 6,000 and 11 percent.
- $800,000 to $999,999: 2,000, 3 percent. July 2,000 and 3 percent. August 2025 2,000 and 4 percent.
- $1,000,000 and over: 2,000, 4 percent. July 3,000 and 6 percent. August 2025 4,000 and 7 percent.
August 2026 and August 2025 each sold 57,000 houses, not seasonally adjusted. Inside that same count, the under-$300,000 band went from 10,000 to 13,000, and the million-dollar-and-over band went from 4,000 to 2,000. That is a mix shift on the official table. It sits next to the average-price drop that cleared the interval. It does not, by itself, say how much of the 8.8 percent was mix and how much was the price of a similar house. Census says both forces are in the number.
The South printed 451,000
Census publishes four regions. Florida is inside the South. The South is not a Florida county, and it is not a Citrus absorption rate.
South sales in August were 451,000 at a seasonally adjusted annual rate. July was 422,000. August 2025 was 436,000. The monthly change is 6.9 percent (±27.7 percent). The yearly change is 3.4 percent (±23.1 percent). Divide 451,000 by the national 684,000 and the South is 65.9 percent of the national pace. That share is arithmetic on the two printed rates. The table itself prints the rates.
Not seasonally adjusted, the South sold 39,000 houses in August, against 35,000 in July and 36,000 in August 2025. South houses for sale, not seasonally adjusted, were 291,000, against 298,000 in July and 305,000 in August 2025. The seasonally adjusted for-sale columns for the regions are marked not applicable. The release does not print a South months’ supply.
Year to date, not seasonally adjusted, the United States has sold 450,000 new houses against 463,000 in the same months of 2025, a change of 2.9 percent (±5.1 percent). The South year to date is 280,000 against 283,000, a change of 1.0 percent (±5.9 percent). The West year to date is 95,000 against 106,000, a change of 10.0 percent (±12.6 percent). All three of those year-to-date intervals include zero. The Northeast year to date is 19,000, unchanged on the point estimate. The Midwest is 55,000 against 56,000.
The other regions, for a reader who wants the whole Table 1a line: Northeast 23,000, Midwest 98,000, West 112,000. A Nature Coast buyer is not in the West’s year-ago decline, and a Nature Coast buyer is not the Midwest’s monthly jump. Both of those moves cleared their intervals. The South’s did not. Use the South as backdrop. Use the house in front of you as the offer.
How this sits next to starts, resales, and the 7.03 percent survey
Three other official files are already out for the same season. They measure different things.
Housing starts, CB26-147, put privately owned housing starts at a 1,275,000 seasonally adjusted annual rate in August. Single-family starts were 918,000. Completions were 1,128,000. A start is ground broken. A completion is a finished unit. A sale in CB26-155 is a contract. The single-family sales rate of 684,000 and the single-family starts rate of 918,000 can both be true in the same month because they are not the same event. Builders can start more houses than they contract in a month, and they can contract houses they started earlier. The completions drop in the construction release and the completed-sales rate of 353,000 in this release are also different counts.
NAR’s August existing-home sales were a 3.98 million seasonally adjusted annual rate, with 1.62 million homes for sale and a 4.9-month supply. New homes in this release are a 684,000 pace, with 483,000 for sale and an 8.5-month supply. The new-home stock is smaller. The months of supply are longer. Adding 4.9 and 8.5 does not produce a combined months’ supply, because the denominators are different sales rates.
The mortgage survey is a third clock, and the calendar matters. Freddie Mac’s weekly 30-year prints already on the record for August were 6.67 percent on August 13, 6.65 percent on August 20, and 6.66 percent on August 27. Contracts in this sales file were signed in that month. The September 24 survey put the 30-year at 7.03 percent and the 15-year at 6.42 percent. The September 17 survey was 6.95 percent and 6.26 percent. The September 16 FOMC vote set the federal funds target range at 3.75–4.00 percent. That vote is after the August contracts. A shopper this weekend is pricing a house against a written quote dated after September 24. The quote starts on the mortgage page. The August sales pace is the contract tape. It is not the quote.
What a Florida buyer and seller do with 684,000
For a buyer shopping a new house, the useful split is the stage. Nationally, the August sales rate was 83,000 not started, 248,000 under construction, and 353,000 completed. Ask which of those three the house is, and ask what the principal and interest become when any builder buydown ends. Run that question at a written quote after the 7.03 percent survey, not at the teaser and not at the August weekly averages. A pre-approval from July is a credit story. VantageScore 4.0 is the credit-score file. The Hometown Heroes briefing is the Florida Housing down-payment file. Neither one reprints the 684,000.
For a resale buyer, an 8.5-month new-home supply is future competition where builders are actually delivering finished houses, and it is a longer wait where the stock is still a slab. Completed new homes for sale were 113,000 nationwide. That is the finished slice. Existing inventory is the NAR file, at 1.62 million and 4.9 months. Shop the house that clears today’s payment. The Florida home buying guide is the process.
For a seller, the national new-home pace does not reprice the listing. Price against current comps and a current quote. The pricing strategy guide is that process. When a lender orders a value, the file is an appraisal. A longer new-home supply can pull some weekend traffic toward a builder incentive. It does not repair an asking price the comps do not support, and it does not rewrite the insurance bill.
Insurance and flood stay on their own line. An 8.5-month national supply does not reprice a roof or a flood zone. Keep the Pasco flood and insurance guide next to the conversation when the house is in a mapped zone. The same paperwork shows up in the Hernando flood guide.
Neighborhood files do not change because the national sales rate printed 684,000: South Tampa and Hyde Park, Wesley Chapel, New Tampa, Dunedin, Clearwater. Statewide context stays on Florida markets. Bridge Point’s residential buying and home selling pages are the service layer when the contract has to be read against a specific address. The residential page is the front door.
The Citrus clocks next to a national sales rate
CB26-155 prints a national rate and four regions. A Lecanto or Homosassa price would have to come from a county table, and this release does not include one. The national median of $393,700 stays a national median.
Four county briefings are already on the site, and each one is a different paper. The people-and-schools briefing carries Census QuickFacts at 171,666 on July 1, 2025, the Bureau of Economic and Business Research’s April 1, 2025 estimate of 166,500, and the school district’s 14,845 preliminary projection for 2025–26. The only countywide owner-occupied value on an official table in that briefing is the Census ACS 2020–2024 median of $245,500. That figure is a multi-year value for owner-occupied housing. The $393,700 in this release is the median sales price of new single-family houses sold in the United States in August 2026. A buyer who sets them side by side and calls either one a September contract price in Citrus has mixed two statistics.
QuickFacts’ 2,102 building permits in Citrus County for 2025 are a county-year authorization count. They are not August new-home sales, and they are not the national 684,000. A permit lets a builder start the paperwork on a unit. A sale in this survey is a deposit or a signed agreement. Keep the permit count next to this tape when the question is how much the county authorized last year. Do not add the two numbers.
Crystal Ridge is the Lecanto PUD where the county’s August 18, 2026 applications list says infrastructure may start. Phase 1 is 234 lots and 10 tracts at 5859 W Crystal Oaks Drive. Phase 2A is about 213 lots. On that list, both final plats were still unfiled. An unfiled plat is not a sale in CB26-155, and a national sales rate does not put a price on a lot that is not recorded.
Black Diamond Town Center is the commercial subdivision the same list already places under construction, improvement plans IMP2024-00001 at 3499 W Norvell Bryant Highway, with final plat FPLT2025-00003 still awaiting the applicant’s revisions. A single-family sales release does not set a pad rent.
The CR-486 interchange map is a comprehensive-plan hearing set for October 26, 2026, at 5:01 p.m. The map is not adopted. A national new-home sales rate does not draw the boundary.
Read them as separate clocks. People and schools say who lives in the county. Crystal Ridge says where dirt may start and where a plat is still out. Town Center says which commercial subdivision is already in the ground. The interchange map says what the board is scheduled to consider on October 26. CB26-155 says how many new single-family contracts the national sample picked up in August, at what stock and at what price. The Citrus County market overview and the Lecanto home guide are the process files when the address is in that county.
A single-family sales file, and a commercial loan file
CB26-155 counts new single-family houses. It does not count apartment leases, and it does not collect a cap rate. The bank-credit file for buildings is the July SLOOS briefing: standards on loans for standing nonresidential and multifamily properties, construction-loan demand, and the H.8 loan book. Census counts contracts. SLOOS asks loan officers whether they will still do the dirt loan.
The second-order link is still the household. A buyer who signs a new-home contract is a household that did not sign a lease that month. Garden-style, build-to-rent, and small mixed-use feel that at the margin. Corridor work stays in the Citrus commercial overview, the Pasco commercial overview, and the Hillsborough commercial overview. Commercial buying is the service layer for a specific building. The commercial page is the front door.
The through-line
August new-home sales printed at 684,000 because that is the seasonally adjusted annual rate in CB26-155. The 6.4 percent increase from revised July 643,000 sits inside a ±19.5 percent interval. The not-seasonally-adjusted month was 57,000 houses, the same count as August 2025. Inventory was 483,000, an 8.5-month supply, with 113,000 of those houses completed. The median price was $393,700. The average price was $478,700, and the 8.8 percent drop from August 2025 is the national price comparison whose interval does not include zero. The South was 451,000. The 30-year survey dated the same Thursday as this release is 7.03 percent, which is a later quote than the August contracts. If you are buying, listing, or walking a still-building street in Hernando, Citrus, Pasco, Hillsborough, or Pinellas, use the stage of the house, a written quote dated after September 24, and a current comp. The mortgage page is where that quote starts. The appraisal page is where a lender’s value order starts.
What to watch next
- September new-home sales: Census and HUD, October 27, 2026. That release is the next sales file. This one is August.
- FHFA House Price Index, July 2026: scheduled for September 29. A repeat-sales index, on its own page when it prints.
- Next Freddie Mac PMMS: October 1, 2026.
- September employment situation: Bureau of Labor Statistics, October 2, 8:30 a.m. Eastern.
- Minutes of the September 15–16 FOMC meeting: October 7.
- September housing starts: Census and HUD, October 20.
- September CPI: October 14.
- Next FOMC: October 27–28. That meeting does not include a new Summary of Economic Projections.
Sources: U.S. Census Bureau and U.S. Department of Housing and Urban Development, Monthly New Residential Sales, August 2026, release CB26-155, September 24, 2026, 10:00 a.m. Eastern, including the public summary and Tables 1a, 1b, 2a, 2b, 3a, and 3b (sales 684,000; July revised 643,000; August 2025 698,000; for sale 483,000; months’ supply 8.5; median $393,700; average $478,700; regional sales; price bands; stage of construction; median months for sale since completion 3.2; year-to-date counts; confidence intervals and the asterisk rule; the four-month trend note; the statement that preliminary sales are revised about 6.7 percent on average; the definition of a sale as a deposit or a signed agreement). Census/HUD New Residential Construction, August 2026, release CB26-147, cited for the 1,275,000 starts rate, the 918,000 single-family starts rate, and the 1,128,000 completions rate. Freddie Mac Primary Mortgage Market Survey via the September 24, 2026 release (30-year 7.03 percent, 15-year 6.42 percent) and FRED series MORTGAGE30US for August 13 (6.67 percent), August 20 (6.65 percent), and August 27 (6.66 percent). FOMC statement of September 16, 2026, cited for the 3.75–4.00 percent funds range. NAR existing-home sales for August 2026, cited for the 3.98 million pace, 1.62 million listings, and 4.9-month supply. Citrus population, school, permit, Crystal Ridge, Black Diamond Town Center, and CR-486 figures are the ones already printed in those briefings from Census QuickFacts, BEBR, Citrus County Schools, and the county development-applications page updated August 18, 2026.
For help reading this release against a specific house or still-building lot in Hernando, Citrus, Pasco, Hillsborough, or Pinellas County, contact Bridge Point Business & Real Estate Advisors at 352-515-0226 or request a consultation.
Questions people ask first
Quick answers to common questions about this topic.
What was the August 2026 new-home sales pace?
Census and HUD put sales of new single-family houses at a seasonally adjusted annual rate of 684,000 in August 2026, release CB26-155, published September 24. The revised July rate was 643,000. The August 2025 rate was 698,000. The not-seasonally-adjusted count for the month was 57,000 houses, the same as August 2025.
Did the 6.4 percent increase clear Census’s confidence interval?
No. The monthly change is 6.4 percent with a 90 percent interval of plus or minus 19.5 percent. That range includes zero, so Census does not treat the increase as statistically significant. The 2.0 percent decline from August 2025, plus or minus 15.7 percent, also includes zero.
How many new houses were for sale, and what was months’ supply?
The seasonally adjusted for-sale inventory was 483,000 at the end of August, the same as revised July and 2.0 percent below August 2025’s 493,000. Months’ supply was 8.5, compared with 9.0 in July and 8.5 in August 2025. Census marks those supply comparisons as inside the error band. Of the 483,000, 113,000 were completed, 256,000 were under construction, and 114,000 were not started.
What were the median and average prices of new houses sold in August 2026?
The median sales price was $393,700. The average sales price was $478,700. July’s median was $392,200 and July’s average was $526,400. August 2025’s median was $417,900 and August 2025’s average was $525,100.
Which price change was statistically significant?
The average price was 8.8 percent below August 2025, and the interval of plus or minus 7.7 percent does not include zero. The median’s 5.8 percent year-ago decline, plus or minus 8.2 percent, does include zero. The average’s 9.1 percent decline from July, plus or minus 11.2 percent, also includes zero.
What did the South region print for new-home sales?
South sales were 451,000 at a seasonally adjusted annual rate, compared with 422,000 in July and 436,000 in August 2025. The monthly change of 6.9 percent and the yearly change of 3.4 percent both have intervals that include zero. Florida is inside the South. The release does not print a Florida or Citrus sales count.
Is this the same report as August housing starts?
No. CB26-155 is new-home sales, meaning a deposit or a signed sales agreement. CB26-147 is housing starts, permits, and completions. August starts were a 1,275,000 pace, with single-family starts at 918,000 and completions at 1,128,000.
Does 684,000 set a Citrus County absorption rate or a local median?
No. The release is national, with four regions. It does not print a Citrus sales pace or a Citrus median. The ACS 2020–2024 median owner-occupied value of $245,500 is a separate multi-year Census figure. Crystal Ridge, Black Diamond Town Center, and the October 26 CR-486 hearing are separate county files.
What mortgage rate applies to these August sales?
The August contracts were signed while Freddie Mac’s weekly 30-year survey printed 6.67 percent on August 13, 6.65 percent on August 20, and 6.66 percent on August 27. The September 24 survey, published the same day as this sales release, put the 30-year at 7.03 percent. A current lock is a written quote dated after September 24.
When is the next new-home sales release?
Census and HUD scheduled the September 2026 new residential sales report for October 27, 2026. August’s 684,000 figure is preliminary and, on Census’s own note, preliminary sales estimates are revised about 6.7 percent on average.
Talk with Bridge Point
Considering a purchase or sale in this market? Local guidance can make a meaningful difference.
Schedule a consultation
