
Market Update · 16 min read
The 30-Year Is 7.40%. That Is the Seventh Straight Rise.
Freddie Mac’s October 8, 2026 survey put the 30-year fixed at 7.40% and the 15-year fixed at 6.73%. The 30-year is 12 basis points above last week’s 7.28% and 110 basis points above the year-ago week at 6.30%. The last weekly 30-year average at or above 7.40% was November 16, 2023, at 7.44%.

Freddie Mac’s Primary Mortgage Market Survey released October 8, 2026 put the 30-year fixed-rate mortgage at 7.40%. The 15-year fixed was 6.73%. The 30-year is 12 basis points above the October 1 print of 7.28%. The 15-year is 13 basis points above 6.60%. A year earlier, the same survey averaged 6.30% on the 30-year and 5.53% on the 15-year. That is 110 basis points higher on the 30-year and 120 basis points higher on the 15-year than the year-ago week.
This file is the October 8 weekly survey. Applications in it were submitted from 12:00 a.m. Eastern on Thursday, October 1, through 11:59 p.m. Eastern on Wednesday, October 7. Freddie publishes the average on Thursday at noon. The September 15–16 FOMC minutes posted on October 7, which is the last day of that application window, and they are a separate Federal Reserve file. September existing-home sales are the separate release scheduled for October 13.
The release line on Freddie Mac’s survey page: “As market conditions continue to evolve, borrowers should remember that shopping around for a mortgage rate and getting multiple quotes can potentially save them thousands over the loan’s lifetime.” A written quote starts on the mortgage page. The dollar figures below are principal and interest on a stated loan. They become a lock when a lender writes one.
The survey Freddie describes is conventional, conforming, fully amortizing home-purchase loans for borrowers who put 20 percent down and have excellent credit. It is an average of applications collected through Loan Product Advisor. Fees and points have not been part of the published average since November 2022, because lenders are not always required to report them. Adjustable-rate averages are not in this release either. A Florida buyer comparing this print with a quote that includes points, mortgage insurance, or a government loan is comparing two different products.
Statewide context stays on Florida markets. The county frames are Citrus, Hernando, Pasco, Hillsborough, and Pinellas. Last week’s 7.28 percent print is inside the September jobs note. The prior standalone survey is the September 24 print at 7.03%.
Seven Thursdays in a row
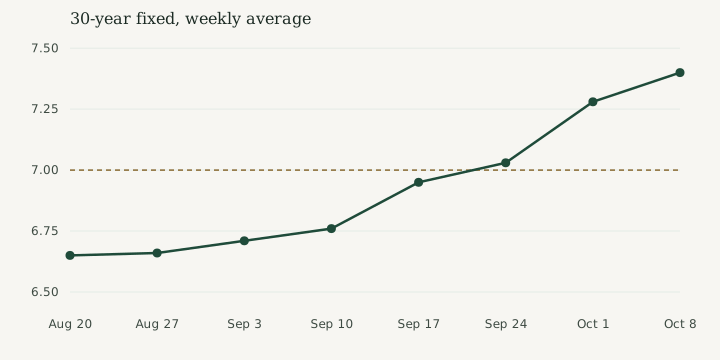
Freddie Mac’s own 2026 archive, and the matching FRED series MORTGAGE30US, print this path for the 30-year fixed:
- August 13: 6.67%
- August 20: 6.65%
- August 27: 6.66%
- September 3: 6.71%
- September 10: 6.76%
- September 17: 6.95%
- September 24: 7.03%
- October 1: 7.28%
- October 8: 7.40%
August 20 was a one-basis-point dip. Every Thursday since August 27 has been higher. That is seven straight weekly increases, from 6.66% to 7.40%. From the August 20 print of 6.65% to this week is 75 basis points. Twenty-five of those basis points arrived on October 1. Twelve more arrived on October 8.
The 15-year fixed on the same archive:
- August 20: 5.95%
- August 27: 5.98%
- September 3: 6.04%
- September 10: 6.09%
- September 17: 6.26%
- September 24: 6.42%
- October 1: 6.60%
- October 8: 6.73%
The 15-year rose 13 basis points this week, one basis point more than the 30-year. The gap between the two products narrowed by that one basis point. On October 1 the 30-year sat 68 basis points above the 15-year. On October 8 the gap is 67 basis points.

The last time the weekly average was this high
On MORTGAGE30US, the last weekly print at or above 7.40% before this one was November 16, 2023, at 7.44%. The week before that, November 9, 2023, was 7.50%. November 2, 2023, was 7.76%. From November 23, 2023 through October 1, 2026, every weekly 30-year average on that series printed below 7.40%. October 8, 2026, at 7.40%, is 4 basis points under the November 16, 2023 print. It is the highest weekly average since that week. It is not a new high versus November 2023.
The climb through 7 percent is already on the record. September 24, at 7.03%, was the first weekly 30-year average at or above 7% since January 16, 2025. October 1 took that to 7.28%. October 8 took it to 7.40%. Three Thursdays, 37 basis points.
What 12 basis points does to a payment
The survey average is a rate. A payment is principal, term, and that rate, run through the standard fully amortizing formula. Monthly principal and interest equals the principal, times the monthly rate, times (1 + monthly rate) raised to the number of months, divided by that same power minus one. The monthly rate is the annual rate divided by 12. A 30-year term is 360 months. A 15-year term is 180 months. The figures below use only the printed survey rates. They leave out taxes, insurance, association dues, and mortgage insurance. They are the arithmetic on Freddie’s average. They are a lock only after a lender writes one.
On $300,000 of principal:
- 30-year at 7.28%: $2,052.64 a month
- 30-year at 7.40%: $2,077.14 a month
- Difference: $24.50 a month, or $294.00 over twelve such payments
- 15-year at 6.60%: $2,629.84 a month
- 15-year at 6.73%: $2,651.40 a month
- Difference: $21.56 a month, or $258.72 over twelve payments
- 30-year at the year-ago 6.30%: $1,856.92 a month
- Difference from this week: $220.22 a month on the same $300,000
On $400,000 of principal:
- 30-year at 7.28%: $2,736.85 a month
- 30-year at 7.40%: $2,769.52 a month
- Difference: $32.67 a month, or $392.04 over twelve payments
- 15-year at 6.60%: $3,506.46 a month
- 15-year at 6.73%: $3,535.20 a month
- Difference: $28.74 a month, or $344.88 over twelve payments
Scaled to a round loan size, the twelve-basis-point move on the 30-year is about $8.17 a month per $100,000 of principal. The thirteen-basis-point move on the 15-year is about $7.19 a month per $100,000. A buyer with a different principal can multiply. A $300,000 loan with 20 percent down is a $375,000 purchase price. A $400,000 loan with 20 percent down is a $500,000 purchase price. Those two prices are illustrations so the survey has a dollar figure. Freddie’s surveyed borrower is the 20-percent-down profile, which is why the examples use that down payment and skip mortgage insurance.
Last week’s move was larger. Twenty-five basis points, from 7.03% on September 24 to 7.28% on October 1, changed the national average more than this week’s twelve. A shopper who already reran the payment after October 1 is looking at another $24.50 a month on a $300,000 30-year loan. A shopper still holding a September 24 quote is comparing that quote with 7.40%, which is 37 basis points and about $75 a month on that same $300,000 loan when the September 24 payment of $2,001.96 is set next to this week’s $2,077.14.

The 10-year during the application week
The September 16 FOMC hike set the federal funds target range at 3.75–4.00% on a 12–0 vote, effective September 17. That is the overnight policy rate. This survey is the house rate on purchase applications from October 1 through October 7. The policy rate and the mortgage average can be printed in the same season and still describe different markets. The next FOMC meeting is October 27–28, with the statement scheduled for 2:00 p.m. Eastern on October 28. This survey does not contain that decision.
The 10-year Treasury yield is the closer cousin, and it is still a different series. FRED DGS10, the daily constant-maturity close, inside this application window:
- October 1: 5.24%
- October 2: 5.28%
- October 5: 5.31%
- October 6: 5.27%
- October 7: 5.28%
October 3 and October 4 were the weekend, so the series has no close those days. From the October 1 close to the October 7 close, the 10-year rose 4 basis points, from 5.24% to 5.28%. Over the weekly mortgage survey that contains those days, the 30-year rose 12 basis points. The mortgage average moved more than the Treasury close across that window. A Florida lock still has to be read off the lender’s quote, not off the 4-basis-point Treasury change.
What else is already on the tape
The September employment report put nonfarm payrolls up 29,000 and the unemployment rate at 4.2%, with 7.1 million people unemployed. Average hourly earnings were $37.81. That release is national. It does not print a Hernando, Citrus, or Pasco rate. August local unemployment, not seasonally adjusted, is the separate metro note: Florida 4.6%, the Tampa-St. Petersburg-Clearwater metro 4.7%.
August new-home sales, in the Census and HUD release, were a seasonally adjusted annual rate of 684,000, with a median price of $393,700 and 8.5 months of supply. August existing-home sales were 3.98 million, with 1.62 million homes for sale, in the resale comparison. September’s resale count is not in this rate survey. July’s national price-per-square-foot comparison, new homes at $205 and existing homes at $212, is the separate Zillow note. The Tampa row in that note was $198 versus $226. It is a metro figure. It is not a Spring Hill price or a Wesley Chapel price.
The federal funds range and this mortgage average answer different questions for an owner who already has a loan. A 30-year note closed in the year-ago week, at a 6.30% average, is not rewritten by Thursday’s 7.40% survey. Refinancing into this week’s average would replace a lower coupon with a higher one on the same term. An owner shopping a purchase of the next house meets 7.40% as the national purchase average for the profile Freddie measures. The payment examples above are that profile. Taxes, insurance, and the local millage are the rest of the monthly number, and they are on the tax bill, not in PMMS.
What a buyer, a seller, or an owner can do with 7.40%
A buyer who was qualified on the October 1 average of 7.28% is looking at about $8.17 more a month per $100,000 of 30-year principal, before taxes and insurance. On a $300,000 loan that is $24.50. On a $400,000 loan it is $32.67. The survey window closed Wednesday night. A quote dated after October 8 can differ from 7.40% because the average is a week of applications, not a single lender’s sheet on Monday, October 12. Ask for the quote in writing, with the date, the term, the points, and whether mortgage insurance is in the payment. Buying sits on residential.
A seller prices the house, not the survey. A buyer who can pay $2,077 a month of principal and interest on a $300,000 30-year loan could pay $2,052.64 on the same loan at last week’s average. That gap is real and it is small next to a price cut measured in thousands. The larger gap is the year. The same $300,000 loan at the year-ago 6.30% was $1,856.92 a month, $220.22 below this week. A seller who last ran the buyer’s payment in October 2025 is using a coupon 110 basis points under the one in this release. Selling sits on residential sales.
An owner with a note already closed does not get a new rate from this survey. The use of the print is the next decision: a purchase, a sale, or a refinance that has to clear 7.40% on the national conforming average before a lender’s own price. The next Freddie survey is Thursday, October 15, at noon Eastern. The October FOMC statement is October 28. This week’s number stands until one of those files replaces it.
A local assignment starts at contact or (352) 515-0226.
Questions people ask first
Quick answers to common questions about this topic.
What was the mortgage rate on October 8, 2026?
Freddie Mac’s Primary Mortgage Market Survey for October 8, 2026 put the 30-year fixed-rate mortgage at 7.40% and the 15-year fixed at 6.73%. A week earlier the averages were 7.28% and 6.60%. A year earlier they were 6.30% and 5.53%. The survey covers conventional, conforming, fully amortizing purchase loans for borrowers who put 20% down and have excellent credit.
How many weeks in a row has the 30-year risen?
Seven. After a one-basis-point dip to 6.65% on August 20, the weekly 30-year average rose on August 27, September 3, September 10, September 17, September 24, October 1, and October 8. The move from 6.65% to 7.40% is 75 basis points. This week’s piece of that move is 12 basis points.
When was the 30-year last this high?
On the FRED series MORTGAGE30US, which matches Freddie Mac’s weekly average, the last print at or above 7.40% before October 8, 2026 was November 16, 2023, at 7.44%. This week is 4 basis points under that print and above every weekly average since.
What does 7.40% do to a $300,000 loan?
Principal and interest on $300,000 for 30 years at 7.40% is $2,077.14 a month. At last week’s 7.28% it is $2,052.64, a difference of $24.50 a month. At the year-ago average of 6.30% it is $1,856.92, a difference of $220.22 a month. Those figures leave out taxes, insurance, and mortgage insurance.
Does this survey include the October Federal Reserve meeting?
No. The applications in the October 8 average were submitted from October 1 through October 7. The next FOMC meeting is October 27–28, and the statement is scheduled for October 28 at 2:00 p.m. Eastern. The federal funds target range in force during this survey is still 3.75% to 4.00%, set on September 16.
Talk with Bridge Point
Considering a purchase or sale in this market? Local guidance can make a meaningful difference.
Schedule a consultation
