
Market Update · 17 min read
September Construction Spending Fell 1.9%. Residential Led the Drop.
Census estimated September 2026 construction spending at a seasonally adjusted annual rate of $2,186.1 billion, 1.9 percent below revised August and 2.7 percent below September 2025. Both comparisons clear zero. Private residential spending fell 5.5 percent on the month. Private nonresidential spending rose 1.1 percent. The first nine months of 2026 are 2.9 percent below the same months of 2025.

Construction spending in September 2026 was estimated at a seasonally adjusted annual rate of $2,186.1 billion. That is 1.9 percent (±0.7 percent) below the revised August estimate of $2,227.4 billion. The 90 percent confidence interval stays below zero. The September figure is 2.7 percent (±1.5 percent) below the September 2025 estimate of $2,245.8 billion. That yearly range stays below zero as well. During the first nine months of 2026, construction spending amounted to $1,649.6 billion, 2.9 percent (±1.0 percent) below the $1,698.6 billion for the same period in 2025.
The Census Bureau published the release at 10:00 a.m. Eastern on Monday, November 2, 2026. The release number is CB26-176. The series is the value of construction put in place. This file is September construction spending. Housing starts are the separate Census construction release.
A buyer, a seller, or an owner in Hernando, Citrus, Pasco, Hillsborough, or Pinellas reads this as the national dollar rate for work put in place in September. The house coupon already briefed on this site is the October 29 Freddie Mac survey: 7.24 percent on the 30-year fixed and 6.60 percent on the 15-year fixed. Policy context after the October FOMC hold remains 3.75–4.00 percent. Statewide context stays on Florida markets. A house sits on residential. A building sits on commercial. A written quote starts on the mortgage page.
What the release measures
Value put in place is the dollar value of construction work done during the period, estimated from several sources and surveys. The headline rate is seasonally adjusted and stated at an annual rate. The table note says the figures are adjusted for seasonality and are not adjusted for price changes. A rise or a fall in the rate can be more work, less work, higher prices on the same work, lower prices, or a mix. This release does not split those pieces.
Census’s explanatory note is the rule for every percent in the text. A statement such as “2.3 percent (±3.1 percent) above” means the likely range, at 90 percent confidence and for sampling error only, runs from 0.8 percent below to 5.4 percent above. If that range contains zero, the change is not statistically significant. If it does not, the change is. The asterisk is the Bureau’s mark for a range that contains zero. The intervals account for sampling variability. They do not remove bias from response, nonreporting, or undercoverage.
On the total, 1.9 percent (±0.7 percent) below August runs from about 2.6 percent below to about 1.2 percent below. That range stays under zero. 2.7 percent (±1.5 percent) below September 2025 runs from about 4.2 percent below to about 1.2 percent below. That range stays under zero. The year-to-date 2.9 percent (±1.0 percent) below runs from about 3.9 percent below to about 1.9 percent below. That range stays under zero too. The month, the year, and the first nine months are all comparisons Census can call declines.
The current month is preliminary. Census says the average absolute percent change from the preliminary estimate to the first revision is 0.65 percent for total construction, 0.75 percent for private construction, and 0.59 percent for public construction. Month-to-month moves in the seasonally adjusted series are often irregular. Census says it may take two months to establish an underlying trend for total construction, and as long as eight months for a specific category.
August’s total was revised. The October 1 August briefing used the then-current $2,203.1 billion. Table 1 in this release revises August to $2,227.4 billion. The September decline is measured from that revised August level, not from the earlier print.
The news release does not print a Florida total, a Citrus total, or a Hernando, Pasco, Hillsborough, or Pinellas total. Unit authorizations for a state month sit in the separate building-permits series. Starts and sales are separate Census and HUD files.
The national rate
Table 1 prints the seasonally adjusted annual rate in millions of dollars. Selected months:
| Month | Total SAAR (millions) | News-release round |
|---|---|---|
| September 2026 | 2,186,145 | $2,186.1 billion |
| August 2026 (revised) | 2,227,374 | $2,227.4 billion |
| July 2026 (revised) | 2,184,026 | — |
| June 2026 | 2,187,350 | — |
| May 2026 | 2,168,396 | — |
| September 2025 | 2,245,799 | $2,245.8 billion |
The dollar gaps are arithmetic on those printed levels. September sits $41.2 billion below revised August on the annualized rate, which is the 1.9 percent the interval supports as a decline. September sits $59.7 billion below September 2025, which is the 2.7 percent the interval supports. Among the months the table prints from May through September, revised August is the high. September sits close to the revised July level after the August jump and the September pullback.
The percent from August is the tested monthly comparison. A reader who subtracts July from September and divides is answering a different question, a two-month step the news release does not test. The release’s sentence is August to September, and that sentence clears.
Private residential led the decline
Spending on private construction was a seasonally adjusted annual rate of $1,639.3 billion, 2.4 percent (±0.5 percent) below the revised August estimate of $1,680.3 billion. That range runs from about 2.9 percent below to about 1.9 percent below. It does not contain zero. Private construction is the part of the September rate whose month the release can call a decline.
Inside private construction, the two blocks moved in opposite directions. Residential construction was $848.8 billion, 5.5 percent (±1.3 percent) below the revised August estimate of $898.0 billion. That range runs from about 6.8 percent below to about 4.2 percent below. It does not contain zero. Nonresidential construction was $790.6 billion, 1.1 percent (±0.5 percent) above the revised August estimate of $782.3 billion. That range runs from about 0.6 percent above to about 1.6 percent above. It does not contain zero.
The private total fell because residential fell hard enough to outweigh the nonresidential gain. A buyer watching houses and an owner watching offices are looking at two lines inside one private rate, and those lines did not share a month.
On the printed millions, private construction is 1,639,330 of the total 2,186,145, which is 75.0 percent of the national rate. Public construction is the other 25.0 percent. Private residential, 848,777 million, is 38.8 percent of the national rate. Those shares are arithmetic on the September levels. The table prints the levels. It does not print the shares.
New houses held. The improvements remainder did not.
The private residential line splits into the two new-construction rows the table prints. New single-family construction was 403,436 million dollars, $403.4 billion, at a seasonally adjusted annual rate. That is 0.0 percent from revised August’s 403,477 million and 2.4 percent below September 2025’s 413,190 million. New multifamily construction was 115,888 million, $115.9 billion, 0.1 percent above revised August’s 115,814 million and 0.2 percent below September 2025’s 116,146 million.
Those percents are the point estimates in Table 1. The news release attaches a confidence interval to private residential as a whole, the 5.5 percent (±1.3 percent) that stays below zero. It does not attach a separate interval, in the text, to the single-family row or the multifamily row. A flat single-family month next to a 5.5 percent residential decline is the arithmetic of the remainder.
Add the two new-construction rows: 403,436 + 115,888 = 519,324 million, $519.3 billion. The private residential total is 848,777 million, $848.8 billion. Footnote 2 says that total includes private residential improvements. The difference is 329,453 million, $329.5 billion. That remainder is 38.8 percent of private residential spending. New single-family is 47.5 percent. New multifamily is 13.7 percent.
The same arithmetic on revised August puts the improvements remainder at 378,704 million, $378.7 billion. The September remainder is $49.3 billion lower on the annualized rate. Nearly all of the private residential decline from August to September sits in that improvements remainder, not in new single-family or new multifamily. Renovation and improvement work is the residential story in this print.
Over the year, the private residential total is the sharper residential fact in the table. September’s 848,777 million is 8.9 percent below September 2025’s 931,223 million. The total residential line, private plus the small public residential piece, is 861,192 million against 944,242 million, 8.8 percent lower. New single-family is 2.4 percent lower than its September 2025 rate. New multifamily is 0.2 percent lower. The yearly residential decline in the point estimates is broad. The monthly residential decline is the one the interval supports as a change.
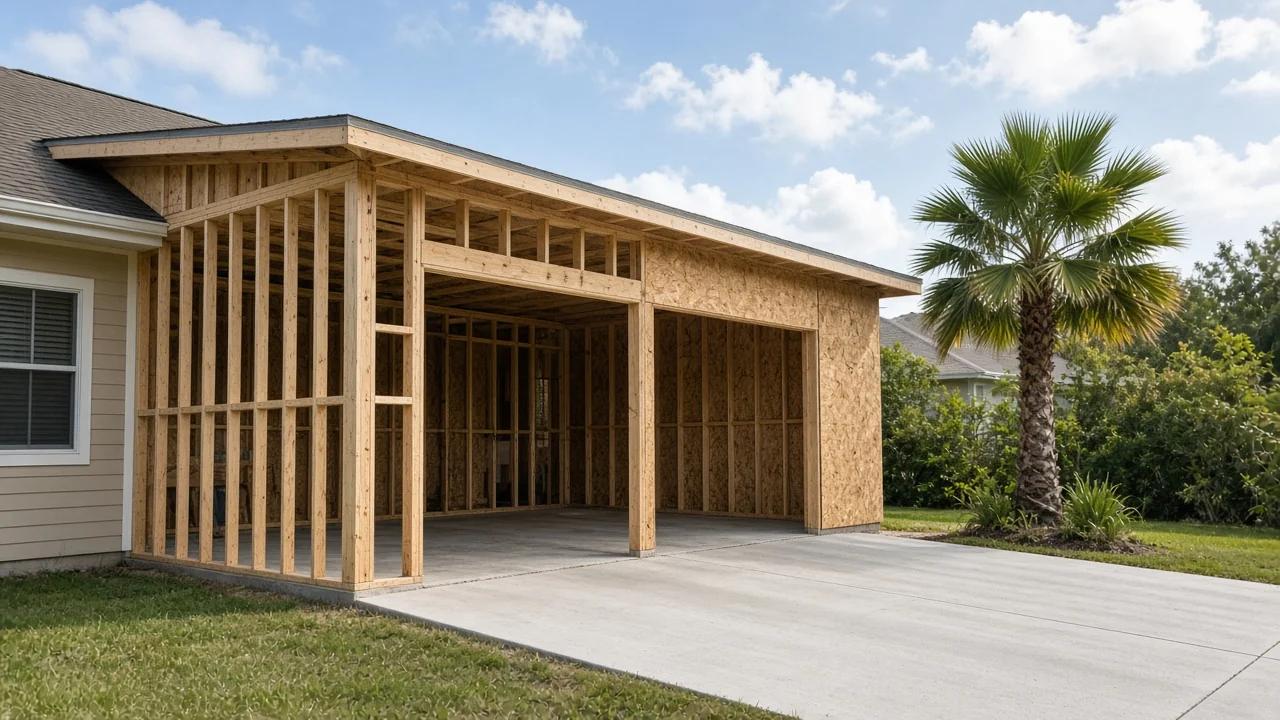
Offices rose. Factories stayed soft on the year.
Private nonresidential spending cleared its month, at 1.1 percent (±0.5 percent). The categories inside it did not move together. The news release states the nonresidential total. The category percents below are the point estimates in Table 1.
| Private category | Sep 2026 SAAR | MoM | YoY |
|---|---|---|---|
| Office | $145.6 billion | +5.5% | +39.5% |
| Power | $171.7 billion | +1.2% | +12.1% |
| Manufacturing | $167.2 billion | −0.3% | −17.9% |
| Commercial | $115.9 billion | −0.3% | −4.4% |
| Health care | $57.7 billion | 0.0% | −1.7% |
| Lodging | $23.6 billion | +0.3% | −2.8% |
Private office construction was 145,633 million dollars. That is 5.5 percent above revised August’s 138,103 million and 39.5 percent above September 2025’s 104,376 million. The dollar gap from a year earlier is $41.3 billion on the annualized rate. Total office construction, private and public together, was 162,299 million, 5.0 percent above August and 33.4 percent above September 2025. The private row is where most of that office rate sits.
Private manufacturing construction was 167,226 million against 167,675 million in revised August. The table prints that monthly change as −0.3 percent. Against September 2025’s 203,744 million, the change is 17.9 percent lower, a gap of $36.5 billion on the annualized rate. Total manufacturing, 170,217 million, is 17.0 percent below September 2025. The factory line is still a large category. It is a smaller large category than it was a year earlier.
Private power construction was 171,658 million, 1.2 percent above August and 12.1 percent above September 2025’s 153,101 million. Total power, private and public, was 191,650 million, 0.9 percent above August and 11.1 percent above September 2025. Office and power are the private nonresidential categories whose yearly point estimates still point higher. Manufacturing’s yearly point estimate still points lower.
An owner of a small office, a shop, a clinic, or a warehouse is reading a national rate for a category, not the rent on a bay in Spring Hill, Lecanto, Wesley Chapel, Tampa, or St. Petersburg. The office rate and the manufacturing rate moved in different directions over the year. A local lease is a third number, and it is not in CB26-176. The service layer for a building is commercial buying. County files stay on their own pages, including the Hernando commercial overview, the Citrus commercial overview, and the Pasco commercial overview.
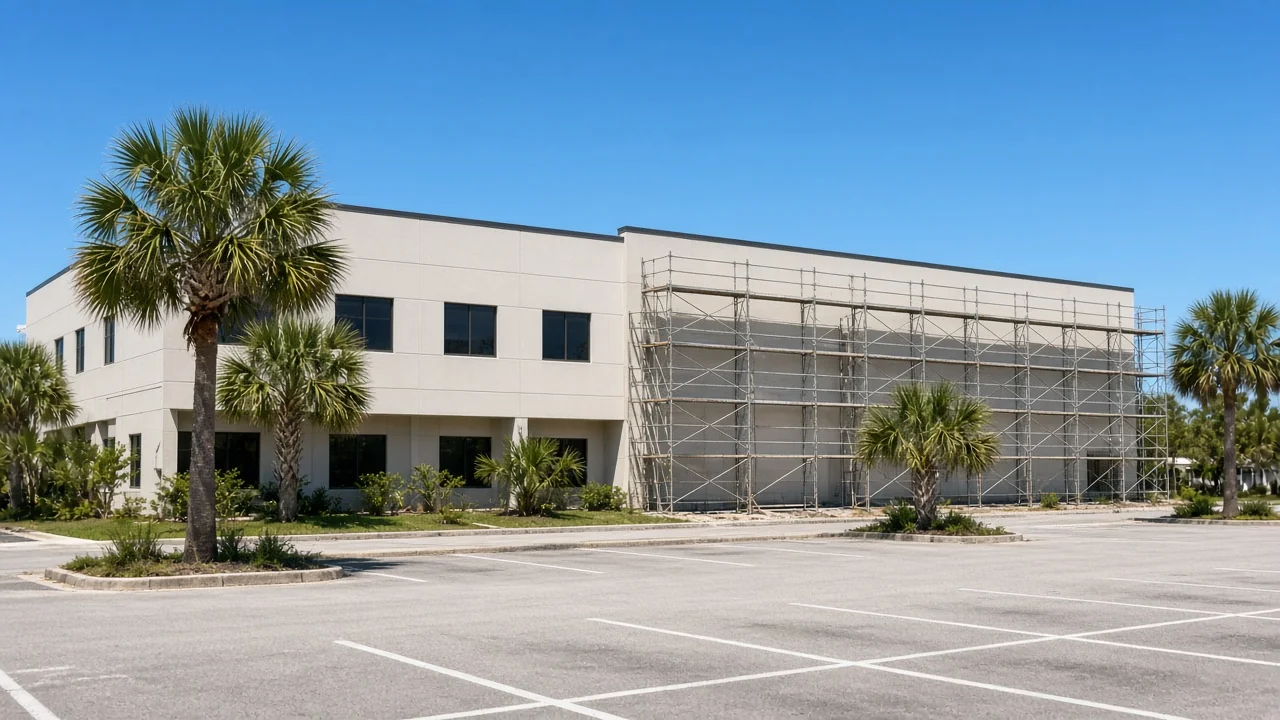
Public work, schools, and highways
Public construction spending was a seasonally adjusted annual rate of $546.8 billion, 0.1 percent (±1.3 percent) below the revised August estimate of $547.1 billion. Census marked that monthly comparison with an asterisk. The range is wide enough to include zero. On the table’s point estimate, the public total is 1.0 percent above September 2025’s 541,429 million. The news release does not attach an interval to that yearly public comparison.
Educational construction, the public line the release names, was $113.1 billion, virtually unchanged from (±1.3 percent)* the revised August estimate of $113.1 billion. That interval includes zero. The table’s point estimate puts public educational spending 1.4 percent below September 2025. A school district’s enrollment and a national educational-construction rate answer different questions. Citrus County’s student count is the separate population and school briefing.
Highway construction was $149.2 billion, 0.3 percent (±3.6 percent) below the revised August estimate of $149.7 billion. That interval includes zero. The public highway-and-street row in the table is 149,220 million, against 144,111 million in September 2025, a point estimate of 3.5 percent higher. The release’s tested sentence for highways is the three-tenths of a percent on the month, and that sentence carries the asterisk.
A national highway rate and a contract on one Florida interstate are different objects. The auxiliary-lane job on Interstate 75 from State Road 200 to State Road 326 is the separate road briefing, with its own construction contract and its own calendar. The $149.2 billion in this release is the seasonally adjusted annual rate for public highway and street work in the United States.
Public residential construction is the small residential piece outside the private total: 12,415 million in September, 1.8 percent above August and 4.6 percent below September 2025 on the table’s point estimates. Private residential at 848,777 million is the residential rate that matters for a house. The public residential row is about 1.4 percent of total residential spending.
The first nine months, without the seasonal factor
The year-to-date comparison in the news release is not seasonally adjusted, and it is the comparison that clears: $1,649.6 billion through September, 2.9 percent (±1.0 percent) below $1,698.6 billion in the same months of 2025. Table 2 prints the unadjusted month as well. September 2026, not annualized and not seasonally adjusted, was 196,349 million dollars, $196.3 billion. September 2025’s unadjusted month was 202,041 million, $202.0 billion.
The same table prints year-to-date point estimates under the residential and private rows. Total residential spending through September is 680,569 million against 712,717 million, 4.5 percent lower. New single-family spending is 306,075 million against 321,620 million, 4.8 percent lower. New multifamily spending is 87,141 million against 87,385 million, 0.3 percent lower. Private office spending is 91,228 million against 77,542 million, 17.6 percent higher. Private manufacturing spending is 128,912 million against 164,739 million, 21.7 percent lower. Public construction is 409,281 million against 404,754 million, 1.1 percent higher.
The tested year-to-date line is the total, down 2.9 percent, and that interval does not include zero. The category year-to-date percents are the point estimates beside it. They line up with the seasonally adjusted year: houses lower, offices higher, factories lower, public work a little higher on the point estimate.
Starts, sales, prices, and the prior spending print
Four other official files sit next to this one. Each one counts a different object.
September housing starts, Census and HUD release CB26-162, put privately owned housing starts at a 1,221,000 seasonally adjusted annual rate. Single-family starts were 859,000. Completions were 1,192,000. A start is a unit begun. A completion is a unit finished. CB26-176 is the dollars of work put in place, across houses and every other category, stated as an annual rate. An 859,000 single-family start rate and a $403.4 billion single-family spending rate can both be the September figures because one counts units and the other counts dollars.
September new-home sales, CB26-174, put sales of new single-family houses at 676,000, with a median price of $400,400. A sale in that release is a deposit or a signed agreement. Spending in this release is work done. Builders can spend on houses they have not yet contracted, and they can contract houses whose spending landed in an earlier month.
The same October 27 stack carried FHFA’s August purchase-only House Price Index at +0.3 percent on the month and +2.4 percent on the year. That is a change in the price of houses that sold again. It is not a construction-spending rate. NAR’s third-quarter metro medians, already briefed as Tampa $410,000, are a closed-sale price tape. They are not the dollars of work put in place in September.
The August construction-spending briefing used the preliminary August total of $2,203.1 billion. This release revises that August total to $2,227.4 billion and then measures September from the revised level. Read September against the revised August. Do not subtract September from the earlier August print.
What a buyer, a seller, and an owner do with it
For a buyer of a house that is still being built, the residential lines are the national backdrop. Private residential spending’s month clears as a decline. Its year, on the table’s point estimate, is 8.9 percent below September 2025. New single-family spending is flat on the month and 2.4 percent below its year-ago rate, and the year-to-date single-family total is 4.8 percent below the same months of 2025. None of those figures is a price for a lot in Hernando, Citrus, Pasco, Hillsborough, or Pinellas, and none of them is a delivery date. The useful local facts are the stage of the house, a written quote dated after the October 29 survey at 7.24 percent, and a current comp. The mortgage page is where the quote starts. An appraisal is the value question on a specific house. Residential buying is the purchase.
For a seller of an existing house, this release is the amount of construction work being done in the country, not the price of the house being listed. The price tapes already on this site for recent months are the House Price Index stack and the NAR metro medians. A pricing conversation still starts from the comparable sales and the condition of the house, which is the subject of the pricing guide. Home selling is where that conversation becomes a listing.
For an owner of a building, or a household that owns a house and is watching a renovation, the split inside the rate is the part worth keeping. Private spending fell on a comparison that cleared. Private residential cleared as a decline, and the residential year is lower on the point estimate. New single-family spending held flat on the month. The improvements remainder inside private residential fell. Private offices are higher than a year ago. Private manufacturing is lower. Public highways and public schools printed monthly moves whose intervals include zero. A renovation of a house sits closer to the improvements remainder, the $329.5 billion left after new single-family and new multifamily. A new bay sits closer to the nonresidential rows. The national rate does not price either project.
The through-line
September construction spending ran at a seasonally adjusted annual rate of $2,186.1 billion. The 1.9 percent decline from revised August $2,227.4 billion sits inside a ±0.7 percent interval that stays below zero. The rate is 2.7 percent (±1.5 percent) below September 2025, and that range stays below zero. The first nine months, $1,649.6 billion, are 2.9 percent (±1.0 percent) below the same months of 2025, and that range stays below zero.
Private construction, $1,639.3 billion, fell 2.4 percent (±0.5 percent), and that range stays below zero. Private residential construction, $848.8 billion, fell 5.5 percent (±1.3 percent), and that range stays below zero. Private nonresidential construction rose 1.1 percent (±0.5 percent), and that range stays above zero. New single-family spending was $403.4 billion, flat on the month. New multifamily spending was $115.9 billion. The improvements remainder inside private residential is $329.5 billion.
On the table’s point estimates, private office spending is 39.5 percent above September 2025 and private manufacturing spending is 17.9 percent below it. Public construction fell 0.1 percent (±1.3 percent) on the month. Public education was virtually unchanged, and public highways fell 0.3 percent, and both of those intervals include zero. The next construction-spending report, covering October, is scheduled for December 1, 2026.
Dates already on the calendar
- Job Openings and Labor Turnover for September: Bureau of Labor Statistics, Tuesday, November 3, 2026, 10:00 a.m. Eastern.
- ISM Services PMI for October: Wednesday, November 4, 2026, 10:00 a.m. Eastern.
- Freddie Mac PMMS: next weekly survey after October 29 — watch the Thursday noon Eastern print.
- October existing-home sales: NAR, Thursday, November 12, 2026, 10:00 a.m. Eastern.
- FOMC minutes of the October 27–28 meeting: Wednesday, November 18, 2026.
- October construction spending, CB26 series: Monday, December 1, 2026.
- December FOMC with a new Summary of Economic Projections: December 8–9, 2026.
Sources: U.S. Census Bureau, Monthly Construction Spending, September 2026, release CB26-176, November 2, 2026, 10:00 a.m. Eastern (total $2,186.1 billion, 1.9 percent (±0.7 percent) below revised August $2,227.4 billion; 2.7 percent (±1.5 percent) below September 2025 $2,245.8 billion; first nine months $1,649.6 billion, 2.9 percent (±1.0 percent) below $1,698.6 billion; private $1,639.3 billion, 2.4 percent (±0.5 percent) below revised August $1,680.3 billion; residential $848.8 billion, 5.5 percent (±1.3 percent) below revised August $898.0 billion; private nonresidential $790.6 billion, 1.1 percent (±0.5 percent) above revised August $782.3 billion; public $546.8 billion, 0.1 percent (±1.3 percent) below revised August $547.1 billion, asterisk; educational $113.1 billion, virtually unchanged (±1.3 percent)*, asterisk; highway $149.2 billion, 0.3 percent (±3.6 percent) below $149.7 billion, asterisk; next release December 1, 2026). Census explanatory notes in that release: ranges are 90 percent confidence intervals and account only for sampling variability; a range that contains zero is not statistically significant; it may take two months to establish a trend for total construction and as long as eight months for a specific category; average absolute revisions from preliminary to first revision are 0.65 percent for total, 0.75 percent for private, and 0.59 percent for public. Table 1, seasonally adjusted annual rate, millions of dollars, not adjusted for price changes (September total 2,186,145; August 2,227,374; July 2,184,026; June 2,187,350; May 2,168,396; September 2025 2,245,799; total residential 861,192 and 944,242, −5.4 percent and −8.8 percent; private residential 848,777 and 931,223, −5.5 percent and −8.9 percent; new single-family 403,436, August 403,477, September 2025 413,190, 0.0 percent and −2.4 percent; new multifamily 115,888, August 115,814, September 2025 116,146, 0.1 percent and −0.2 percent; footnote 2, private residential includes improvements; private nonresidential 790,554 and 773,148, 1.1 percent and 2.3 percent; private office 145,633, August 138,103, September 2025 104,376, 5.5 percent and 39.5 percent; total office 162,299, 5.0 percent and 33.4 percent; private manufacturing 167,226, August 167,675, September 2025 203,744, −0.3 percent and −17.9 percent; total manufacturing 170,217, −17.0 percent on the year; private power 171,658 and 153,101, 1.2 percent and 12.1 percent; total power 191,650, 0.9 percent and 11.1 percent; private commercial 115,924 and 121,292, −0.3 percent and −4.4 percent; private lodging 23,593 and 24,285, 0.3 percent and −2.8 percent; private health care 57,664 and 58,661, 0.0 percent and −1.7 percent; public 546,815 and 541,429, −0.1 percent and 1.0 percent; public residential 12,415, 1.8 percent and −4.6 percent; public educational 113,069 and 114,729, 0.0 percent and −1.4 percent; public highway and street 149,220 and 144,111, −0.3 percent and 3.5 percent). Table 2, not seasonally adjusted (September month 196,349 million; September 2025 month 202,041 million; year-to-date total 1,649,634 and 1,698,613, −2.9 percent; residential 680,569 and 712,717, −4.5 percent; new single-family 306,075 and 321,620, −4.8 percent; new multifamily 87,141 and 87,385, −0.3 percent; private office 91,228 and 77,542, 17.6 percent; private manufacturing 128,912 and 164,739, −21.7 percent; public 409,281 and 404,754, 1.1 percent). Disclosure Review Board approval CBDRB-FY26-0231. Census/HUD new residential construction and new residential sales, FHFA House Price Index, NAR metro medians, Freddie Mac Primary Mortgage Market Survey, and Federal Reserve FOMC statement, only as already briefed on those pages.
For help reading a Hernando, Citrus, Pasco, Hillsborough, or Pinellas purchase, sale, or building against this spending rate and a current written quote, contact Bridge Point Business & Real Estate Advisors at 352-515-0226 or request a consultation.
Questions people ask first
Quick answers to common questions about this topic.
What was U.S. construction spending in September 2026?
The Census Bureau estimated September 2026 construction spending at a seasonally adjusted annual rate of $2,186.1 billion. That is 1.9 percent below the revised August estimate of $2,227.4 billion and 2.7 percent below the September 2025 estimate of $2,245.8 billion. Census published the figures on November 2, 2026, in release CB26-176. The first nine months of 2026 totaled $1,649.6 billion, 2.9 percent below the same months of 2025.
Did the monthly decline in construction spending clear the confidence interval?
Yes. The 1.9 percent decline from August sits inside a margin of plus or minus 0.7 percent, and that 90 percent confidence interval stays below zero. The 2.7 percent decline from September 2025, margin plus or minus 1.5 percent, stays below zero. The 2.9 percent year-to-date decline, margin plus or minus 1.0 percent, stays below zero as well.
How did private residential construction spending change in September?
Private construction fell 2.4 percent from August to $1,639.3 billion, and that margin of plus or minus 0.5 percent does not include zero. Private residential spending was $848.8 billion, 5.5 percent below August with a margin of plus or minus 1.3 percent, so that residential month also clears as a decline. New single-family spending was $403.4 billion, flat on the month. New multifamily spending was $115.9 billion. The private residential total includes improvements.
Which large private categories were higher than a year earlier, and which were lower?
On Table 1’s point estimates, private office construction was 39.5 percent above September 2025, and private power construction was 12.1 percent above. Private manufacturing construction was 17.9 percent below September 2025. Private commercial construction was 4.4 percent below, and private lodging was 2.8 percent below. The news release attaches its confidence intervals to the totals it states in the text, not to each of these category rows.
What happened to public construction, schools, and highways?
Public construction was $546.8 billion, 0.1 percent below August, and that margin of plus or minus 1.3 percent includes zero. Public educational construction was $113.1 billion, virtually unchanged with a margin of plus or minus 1.3 percent. Public highway construction was $149.2 billion, down 0.3 percent with a margin of plus or minus 3.6 percent. Both of those monthly intervals include zero.
Does this release print construction spending for Florida or Citrus County?
No. CB26-176 is a national value-put-in-place release. It does not print a Florida total or a county total. Florida housing-unit authorizations are in the separate building-permits series.
How does construction spending differ from housing starts?
Construction spending is the dollar value of work put in place, stated here as a seasonally adjusted annual rate. Housing starts, Census and HUD release CB26-162, count units begun. September starts were a 1,221,000 pace, with single-family starts at 859,000. A start and a dollar of spending are different measures of construction.
When is the next construction spending report?
Census scheduled the October 2026 construction spending report for December 1, 2026. The September JOLTS release is due November 3, and the October ISM Services PMI is due November 4.
Talk with Bridge Point
Considering a purchase or sale in this market? Local guidance can make a meaningful difference.
Schedule a consultation
