
Market Update · 18 min read
September Starts Were 1.221 Million. Completions Are Still 14% Below a Year Ago.
Census and HUD put September 2026 housing starts at a 1.221 million seasonally adjusted annual rate, 5.2 percent below the revised August rate of 1.288 million, with Census marking that move as not statistically different from zero. Single-family starts were 859,000. Permits were 1.400 million. Completions were 1.192 million, up 2.2 percent on the month on an interval that includes zero and 14.0 percent below September 2025.

Census and HUD put privately owned housing starts in September 2026 at a seasonally adjusted annual rate of 1,221,000. That is in the joint Monthly New Residential Construction release CB26-162, published Tuesday, October 20, 2026, at 8:30 a.m. Eastern. The September rate is 5.2 percent below the revised August estimate of 1,288,000 and 7.4 percent below the September 2025 rate of 1,319,000. Census prints a 90 percent confidence interval of ±11.8 percent on the monthly change and ±11.5 percent on the yearly change. Both intervals include zero, and Census marks both with an asterisk. In plain terms, the release does not provide enough statistical evidence to conclude that the actual starts change was different from zero. This release counts houses started; September new-home sales are a separate Census release.
Single-family starts were 859,000, 4.6 percent below the revised August figure of 900,000, on a ±10.0 percent interval that also includes zero. Starts in buildings with five units or more were 349,000. A start is a unit that has broken ground in the survey. It is not a contract, it is not a closing, and it is not a finished house you can walk through this weekend. For anyone shopping in Florida, the national pace matters as backdrop. The house, the lot, the builder contract, and the written payment quote in front of you are still the decision. Statewide context stays on Florida markets, and purchase work sits on residential.
The August briefing on this site, Starts Were 1.275 Million. Completions Fell 12%., used the August figure as first published in CB26-147. This September release revises that August starts rate to 1,288,000. August single-family starts are revised to 900,000 in this file, August permits to 1,403,000, and August completions to 1,166,000. September is preliminary and August is revised in CB26-162. That revision history is part of the story: a monthly starts rate is an estimate that moves as more returns come in, not a final count of every foundation poured in the country.
The September scoreboard
Seasonally adjusted annual rates from CB26-162, September 2026:
- Housing starts: 1,221,000 — 5.2 percent (±11.8 percent)* below revised August 1,288,000, and 7.4 percent (±11.5 percent)* below September 2025 at 1,319,000.
- Single-family starts: 859,000 — 4.6 percent (±10.0 percent)* below revised August 900,000. Against September 2025, single-family starts are 2.6 percent higher on the table, on a ±9.5 percent interval that includes zero.
- Five-or-more-unit starts: 349,000 — 7.2 percent below August on a ±27.7 percent interval that includes zero, and 25.9 percent below September 2025 on a ±21.5 percent interval that does not include zero.
- Building permits: 1,400,000 — 0.2 percent below the revised August rate of 1,403,000 and 3.0 percent below September 2025 at 1,444,000.
- Single-family permits: 845,000 — 4.0 percent below the revised August figure of 880,000. Permits for units in buildings with five units or more were 503,000.
- Housing completions: 1,192,000 — 2.2 percent (±10.8 percent)* above the revised August estimate of 1,166,000, and 14.0 percent (±11.1 percent) below September 2025 at 1,386,000.
- Single-family completions: 840,000 — 2.4 percent (±10.8 percent)* below the revised August rate of 861,000. Completions in buildings with five units or more were 339,000, 14.9 percent above August on a ±34.4 percent interval that includes zero.
The asterisk matters, and Census defines it on the release: the 90 percent confidence interval includes zero, so there is insufficient statistical evidence to conclude that the actual change is different from zero. That applies to the headline monthly starts decline, to the single-family monthly decline, and to the monthly completions increase. It does not apply the same way to the year-over-year completions decline. Completions at 1,192,000 are 14.0 percent below 1,386,000 a year earlier, and the ±11.1 percent interval around that change stays below zero. Builders are finishing at a pace well under last September, even if the one-month bounce from August cannot be separated from no change at all.
Census also cautions that month-to-month moves in seasonally adjusted series can be irregular. It may take three months to establish an underlying trend for building permit authorizations, six months for total starts, and six months for total completions. September is one month inside that warning. A buyer who treats a single 1.221 million print as a promise about how many finished homes will be for sale in Hernando or Pasco next spring is asking the release to do work it was not built to do.
Permits held near August. Single-family permits fell.
Permits are authorizations to build. Starts are ground broken. In September, total permits at 1,400,000 were almost level with revised August at 1,403,000. The mix shifted. Single-family authorizations fell to 845,000 from 880,000, a 4.0 percent decline. Authorizations in buildings with five units or more rose to 503,000. Two-to-four-unit authorizations were 52,000 on the seasonally adjusted table. Against a year earlier, total permits are down 3.0 percent from 1,444,000, single-family permits are down 4.8 percent from 888,000, and five-or-more-unit permits are up 1.0 percent from 498,000.
Units authorized but not started at the end of September were 279,000 on a seasonally adjusted basis, 0.4 percent above August on a ±2.2 percent interval that includes zero. Single-family units in that authorized-but-not-started pool were 151,000, unchanged from August. That pool is permission waiting for a start. It is not a finished home, it is not a listing, and it does not tell a Florida shopper when a particular street will open, what a builder will ask, or whether a lot premium applies. It does say the pipeline of permitted work has not emptied.
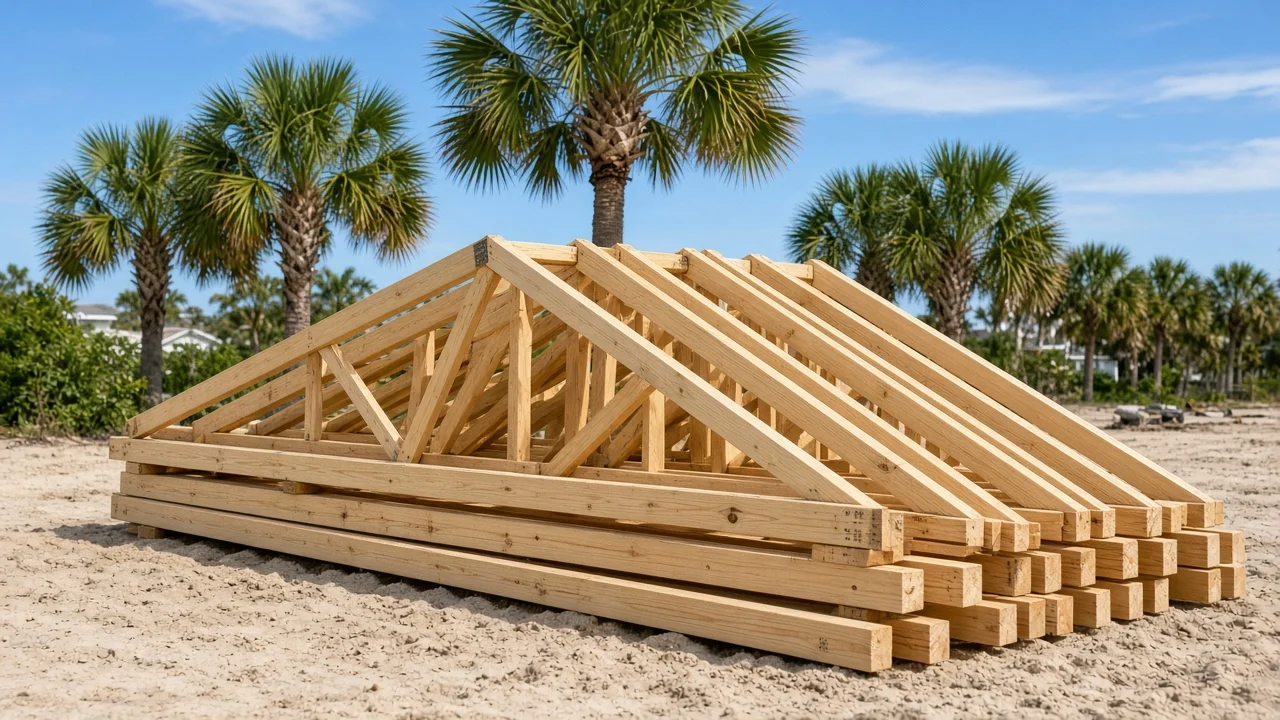
For a new-construction shopper, the permit-to-start sequence is useful at the level of the individual house. Ask whether the house you are considering is permitted, started, under construction, or complete. Those are different stages with different risks. A permitted-but-not-started house can face schedule changes. A house under construction has a frame and a sequence of inspections ahead of it. A completed house can be walked, inspected, and closed on a timetable that a slab cannot offer. The national totals put September permits above starts — 1,400,000 against 1,221,000 — but your contract is for one address, not for a national rate.
Under construction was flat. That is the inventory in progress.
Housing units under construction at the end of September were 1,280,000 seasonally adjusted, unchanged from August. Single-family units under construction were 587,000, also unchanged. Units under construction in buildings with five units or more were 677,000, unchanged as well. Against September 2025, total units under construction are down 3.3 percent, on a ±2.7 percent interval that does not include zero. Single-family units under construction are down 2.8 percent from a year earlier, and five-or-more units under construction are down 3.1 percent.
That flat monthly line, sitting between a softer starts print and a completions pace that is down 14.0 percent from a year earlier, describes a large stock of work already underway. Starts feed that stock. Completions draw it down. When starts and completions both run below year-ago levels and the under-construction total holds level for a month, the near-term supply question becomes how quickly the homes already framed are finished and offered, not whether a single monthly starts dip has turned off construction nationally.
Year-to-date figures, not seasonally adjusted, tell a steadier story through September. Total starts through the first nine months of 2026 are down 1.1 percent from the same period in 2025, on a ±3.6 percent interval that includes zero. Single-family starts year to date are down 4.0 percent, on a ±3.2 percent interval that stays below zero. Five-or-more-unit starts year to date are up 6.9 percent, on a ±10.9 percent interval that includes zero. Completions year to date are down 12.5 percent, on a ±5.2 percent interval that stays below zero, with single-family completions down 10.8 percent. The finishing slowdown against last year is the clearest trend in the file.
The South rose on the month. Florida is not broken out.
Census publishes four regions: Northeast, Midwest, South, and West. Florida is inside the South. This release does not publish a Florida starts figure, and nothing in it should be read as a Florida starts count.
South-region figures, seasonally adjusted annual rates for September 2026:
- South starts: 714,000 — 6.1 percent above revised August 673,000, on a ±15.5 percent interval that includes zero, and 11.0 percent above September 2025 on a ±20.4 percent interval that includes zero.
- South single-family starts: 506,000 — 3.3 percent below August 523,000, on a ±12.4 percent interval that includes zero.
- South permits: 759,000 total, with 505,000 single-family. Total South permits are 1.5 percent above August, while single-family South permits are 4.4 percent below August.
- South completions: 604,000 total, with 472,000 single-family. Total South completions are 6.1 percent below August on a ±11.7 percent interval that includes zero, and 21.3 percent below September 2025 on a ±12.7 percent interval that does not include zero.
- South under construction: 570,000 total, with 296,000 single-family, up 1.1 percent in total from August.
- South authorized but not started: 165,000 total, with 93,000 single-family, unchanged in total from August.
The South can rise on the monthly starts table while single-family South starts ease, because the regional total includes multifamily work. None of those regional lines price a home in Citrus, Hernando, Pasco, Hillsborough, Pinellas, or Marion County. Citrus County has its own local permit history, covered in 2,102 permits and the school work plan, where Census counted 2,102 housing units authorized in Citrus County in the final annual 2025 permit file. That county-year authorization total is a different measurement from a national September starts rate, and the two should sit side by side rather than be added together.
How this sits next to rates, sales, and local jobs
A starts release does not set a mortgage payment. The most recent mortgage briefing on this site is the October 8 Freddie Mac survey at 7.40 percent, with the 30-year fixed at 7.40 percent and the 15-year at 6.73 percent. That survey is the payment backdrop a buyer brings to a builder meeting. A builder buydown, a lot premium, taxes, insurance, and association costs then shape the actual monthly figure for a specific house. September starts at 1.221 million do not lower that survey rate, and the survey rate does not change how many units Census counted as started.
Sales are a different clock again. September existing-home sales, consumer prices, and the Fed minutes covered the resale pace of 3.99 million and a South median of $361,000 in that separate briefing. Those are homes that already exist changing hands. A September start is a home that does not exist yet. A resale seller competes with other resale listings today and with completed new homes in the same search, not with a framed house that will finish months from now. The August new-home sales briefing is the separate contract-sales file from Census and HUD, and it answers a different question from this construction file.
Local work is a third clock. Florida September employment and unemployment put the state seasonally adjusted unemployment rate at 4.4 percent and Citrus County, not seasonally adjusted, at 6.3 percent. Construction payrolls statewide were 657,000 on that labor file. A national starts rate and a Florida construction payroll count can move in different directions in the same month because one counts units begun in a national survey and the other counts people on Florida payrolls. A buyer employed locally lives in that labor file. A builder deciding whether to start the next phase reads permits, sales pace, costs, and financing alongside it.
What buyers, sellers, and owners can use
For a buyer comparing a resale home with a home still being built, September argues for staging questions over headline questions. Is the new home complete, under construction, or not yet started? What is the written completion window, and what happens if it slips? What is the full payment at the note rate, not only during any introductory buydown period? How do taxes, insurance, and association costs compare with the resale alternative? A national completions pace down 14.0 percent from a year earlier means fewer newly finished homes nationally than last September. It does not mean the specific finished home you want will wait, and it does not mean a framed home will finish on your preferred closing date.
For a seller, the useful sentence is narrow. New supply already finished is the direct competition for a buyer who can move now. Starts at 859,000 single-family units are future supply, and Census marks the monthly decline as statistically indistinguishable from zero. Price and condition still have to meet current demand, current financing, and comparable closed sales. A starts headline does not repair an optimistic asking price, deferred maintenance, or an insurance problem, and a soft starts month does not by itself create a bidding contest for a home that has been sitting.
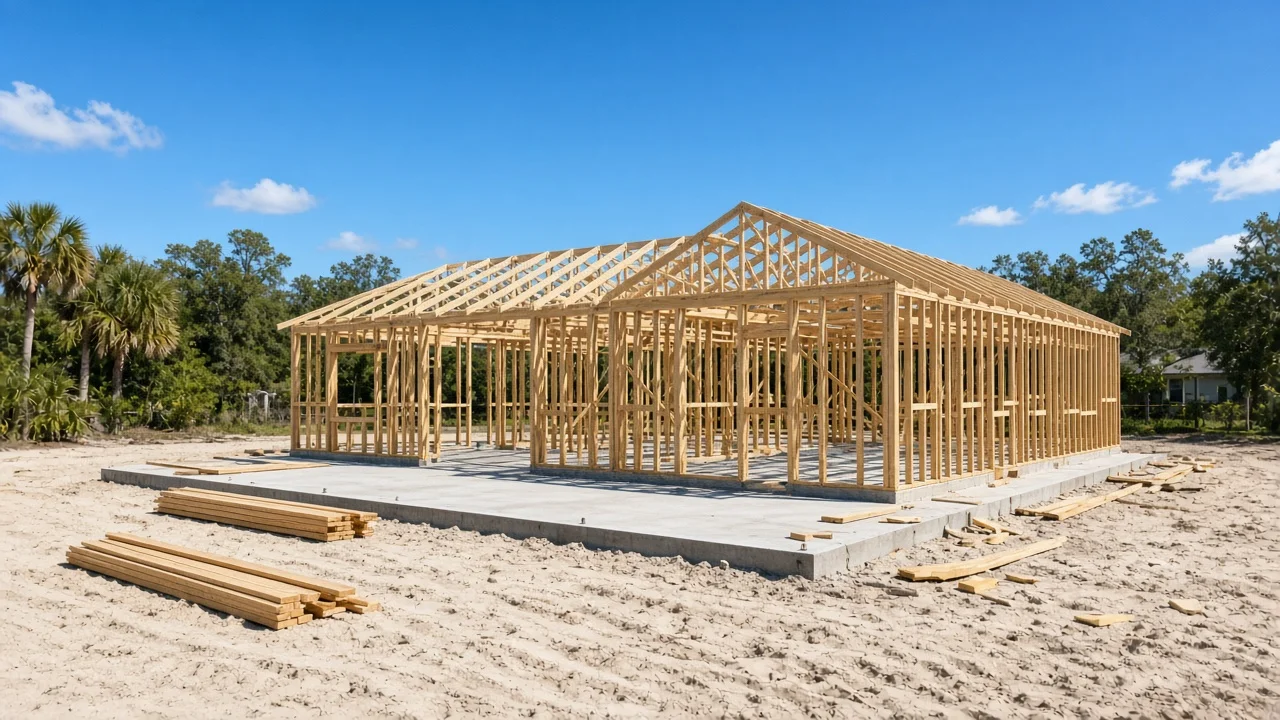
For an owner watching a nearby subdivision, the stages in this release map onto what you can see from the road. Permitted-but-not-started work may show as cleared land with no frame. Starts show as slabs and framing. Units under construction show as the framed and roofed houses that stay in that stage until they are finished. Completions are the houses that move to occupancy. September held the national under-construction total at 1,280,000 while completions remained below last year. Streets already underway should keep finishing in sequence, even when a monthly starts figure moves inside a wide confidence band.
For a new-construction shopper in Florida, the Citrus permit history and the national construction file answer different parts of the same visit. The county file can tell you that Citrus authorized 2,102 units in 2025. The September national file can tell you that single-family permits nationally fell to 845,000 and single-family starts were 859,000, both on intervals that include zero for the monthly starts move. Neither file tells you a builder holdback, a release price, or whether a particular lot carries a premium. Those answers come from the builder contract and from comparable finished sales, reviewed before earnest money becomes nonrefundable.
The through-line is discipline about what changed clearly and what did not. Completions are clearly below a year earlier, down 14.0 percent nationally and 21.3 percent in the South, with intervals that exclude zero. Year-to-date completions are clearly down 12.5 percent. The monthly starts decline, the single-family monthly decline, and the monthly completions increase are all inside intervals that include zero. Permits held near August in total while single-family permits fell. The stock under construction held at 1,280,000. That is a picture of a large pipeline finishing more slowly than last year, not a sudden stop and not a new building boom.
The next Monthly New Residential Construction release, for October 2026, is scheduled for November 18, 2026. Between now and then, a Florida buyer is better served by a current written quote, a clear construction stage for any new home under consideration, and comparable sales for the neighborhood in question than by waiting for the next national starts print to settle a decision that a specific house is already posing.
Sources: U.S. Census Bureau and U.S. Department of Housing and Urban Development, Monthly New Residential Construction, September 2026, release CB26-162, October 20, 2026, at 8:30 a.m. Eastern, including the summary and Tables 1a, 2a, 3a, 3b, 4a, and 5a, and the explanatory notes on 90 percent confidence intervals, sampling variability, and trend length. August figures cited as revised are the revised August estimates printed in CB26-162. The August briefing as first published is the separate CB26-147 file.
For help reading a new-construction contract or a resale choice against this construction picture in Citrus, Hernando, Pasco, Hillsborough, or Pinellas County, contact Bridge Point Business & Real Estate Advisors at 352-515-0226 or request a consultation.
Questions people ask first
Quick answers to common questions about this topic.
How many housing starts were there in September 2026?
Census and HUD put privately owned housing starts at a seasonally adjusted annual rate of 1,221,000 in September 2026. That is 5.2 percent below the revised August estimate of 1,288,000, on a 90 percent confidence interval of ±11.8 percent that includes zero, so Census marks the monthly change with an asterisk as not statistically different from zero.
How many single-family homes were started in September 2026?
Single-family housing starts were 859,000 at a seasonally adjusted annual rate, 4.6 percent below the revised August figure of 900,000 on a ±10.0 percent interval that includes zero. Starts in buildings with five units or more were 349,000.
What were building permits in September 2026?
Building permits were 1,400,000 at a seasonally adjusted annual rate, 0.2 percent below revised August 1,403,000 and 3.0 percent below September 2025. Single-family authorizations were 845,000, down 4.0 percent from 880,000. Authorizations in buildings with five units or more were 503,000.
What were housing completions in September 2026?
Housing completions were 1,192,000 at a seasonally adjusted annual rate, 2.2 percent above revised August 1,166,000 on a ±10.8 percent interval that includes zero, and 14.0 percent below September 2025 at 1,386,000 on a ±11.1 percent interval that does not include zero. Single-family completions were 840,000.
How many homes were under construction in September 2026?
Units under construction at the end of September were 1,280,000 seasonally adjusted, unchanged from August. Single-family units under construction were 587,000 and units in buildings with five units or more were 677,000. The total is 3.3 percent below September 2025.
Did the South region rise in September 2026?
South starts were 714,000, 6.1 percent above August on a ±15.5 percent interval that includes zero. South single-family starts were 506,000. South permits were 759,000 and South completions were 604,000. Census does not publish a Florida starts figure in this release.
Does this release report Florida housing starts?
No. Census publishes the South region, which includes Florida, but it does not break out a Florida starts rate in CB26-162. The South figures are regional backdrop, not a Florida or county start count.
How was August 2026 revised in this release?
CB26-162 revises August starts to 1,288,000, from 1,275,000 as first published in CB26-147. August single-family starts are revised to 900,000, August permits to 1,403,000, and August completions to 1,166,000.
When is the next housing starts release?
The next Monthly New Residential Construction release, covering October 2026, is scheduled for November 18, 2026, from the Census Bureau and HUD.
Who can help apply this to a Florida home purchase?
Bridge Point Business & Real Estate Advisors advises buyers, sellers, and owners across Citrus, Hernando, Pasco, Hillsborough, and Pinellas Counties. Call 352-515-0226 or request a consultation through the contact page.
Talk with Bridge Point
Considering a purchase or sale in this market? Local guidance can make a meaningful difference.
Schedule a consultation
