
Market Update · 16 min read
September Prices Rose 0.6%. Existing Homes Sold at a 3.99 Million Pace.
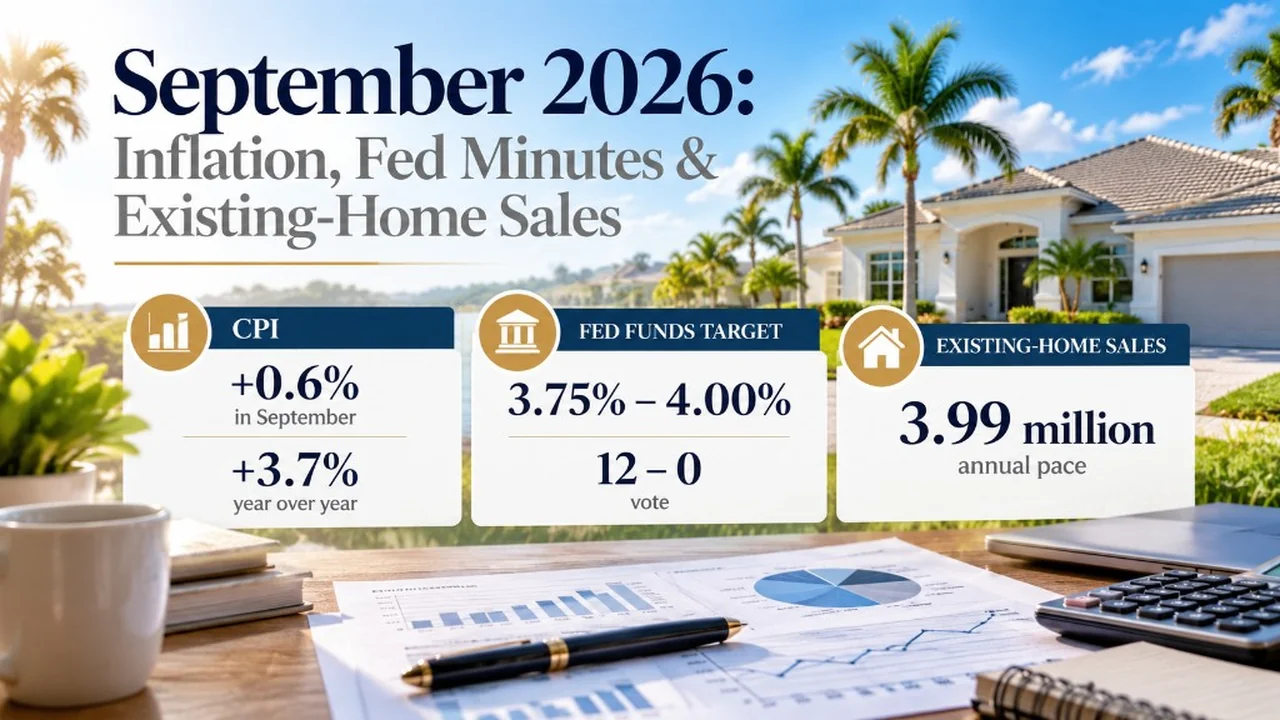
September consumer prices rose 0.6 percent, and 3.7 percent over the year. The minutes of the September 15–16 meeting record a 12–0 funds-rate range of 3.75 to 4.00 percent. Existing-home sales in September ran at 3.99 million.

September consumer prices rose 0.6 percent. The September 15–16 minutes record a funds-rate range of 3.75 to 4.00 percent. Existing homes sold in September at a seasonally adjusted annual rate of 3.99 million. Shelter rose 0.4 percent inside that price index, and the 12-month all-items rate is 3.7 percent.

Those three figures come from three files. The Bureau of Labor Statistics published the Consumer Price Index for September on October 14, 2026, at 8:30 a.m. Eastern. The Federal Reserve posted the minutes of the September 15–16 meeting on October 7. The National Association of Realtors published Existing-Home Sales for September on October 13. Each number below stays with the file that printed it.
August’s price index is the August CPI briefing: all items up 0.4 percent that month and 3.4 percent over the twelve months ending August. The September 16 decision itself is the hike note. August’s resale count, about 3.98 million, is the August sales snapshot. Statewide context stays on Florida markets. A purchase or a sale sits on residential.
The September price index
The Consumer Price Index for All Urban Consumers increased 0.6 percent on a seasonally adjusted basis in September, after rising 0.4 percent in August. Over the last 12 months the all-items index increased 3.7 percent before seasonal adjustment. BLS reported that on Wednesday, October 14, in release USDL-26-1574. The August year-over-year rate on the earlier briefing was 3.4 percent. September’s 3.7 percent is the twelve months ending September.
The index for gasoline rose 9.1 percent in September and accounted for over half of the monthly all-items increase. Before seasonal adjustment, gasoline prices increased 6.5 percent in September. The energy index increased 5.2 percent over the month, following a 2.1 percent increase in August. Over twelve months, energy increased 20.4 percent, and gasoline increased 34.2 percent. Electricity rose 0.2 percent over the month and 4.4 percent over the year. Natural gas decreased 0.3 percent over the month and increased 5.0 percent over the year.
The index for all items less food and energy rose 0.3 percent in September, as it did in August. Over twelve months that core index rose 2.6 percent, following a 2.4 percent increase over the twelve months ending August. Food was unchanged in September. Food away from home increased 0.2 percent, and food at home fell 0.1 percent. Over the year, food increased 2.5 percent, food at home 1.8 percent, and food away from home 3.5 percent.
The seasonally adjusted all-items path in the release’s Table A runs 0.9 percent in March, 0.6 in April, 0.5 in May, a 0.4 percent decline in June, 0.1 in July, 0.4 in August, and 0.6 in September. September’s 0.6 percent matches April and sits under March’s 0.9 percent on that row.
Inside the core, the release names the indexes that increased: recreation rose 0.5 percent after being unchanged in August, used cars and trucks rose 0.7 percent, education rose 0.6 percent, airline fares rose 1.2 percent, apparel rose 0.3 percent, and medical care rose 0.1 percent after falling 0.2 percent in August. Hospital services rose 0.7 percent. Prescription drugs declined 1.2 percent. Physicians’ services were unchanged. The communication index declined 0.2 percent after rising 2.3 percent in August. Household furnishings and operations were unchanged. Over the year, airline fares increased 22.4 percent, recreation 2.8 percent, medical care 1.5 percent, and education 3.8 percent.
On the grocery detail, three of the six major food-at-home groups decreased and three increased. Meats, poultry, fish, and eggs decreased 0.5 percent, and the beef index fell 1.0 percent. Dairy and related products decreased 0.9 percent, and milk declined 2.0 percent. Nonalcoholic beverages increased 0.9 percent. Fruits and vegetables rose 0.5 percent. Cereals and bakery products increased 0.1 percent. Full-service meals rose 0.3 percent, and limited-service meals rose 0.2 percent.
Before seasonal adjustment, the CPI-U stands at 336.940 (1982–84=100). That index rose 3.7 percent over twelve months and 0.6 percent on the month. The CPI-W increased 3.9 percent over twelve months to 330.654, and 0.7 percent on the month before seasonal adjustment. The chained CPI-U increased 3.5 percent over twelve months and 0.5 percent on the month on an unadjusted basis, and BLS notes that the chained index for recent months is subject to revision. The October CPI release is scheduled for Tuesday, November 10, 2026, at 8:30 a.m. Eastern.
Shelter inside that index
The shelter index rose 0.4 percent in September after rising 0.3 percent in August, and it increased 3.2 percent over the last year. Owners’ equivalent rent rose 0.3 percent in September. Rent of primary residence rose 0.2 percent. Lodging away from home rose 2.0 percent after rising 2.4 percent in August.
The September release’s relative-importance column prints shelter at 35.323 percent of the CPI-U. Owners’ equivalent rent of residences is 25.902 percent. Rent of primary residence is 7.728 percent. Services less energy services, the broader basket shelter sits inside, is 60.240 percent and rose 0.4 percent on the month and 3.1 percent over the year. On the same table, owners’ equivalent rent of residences is up 3.3 percent over the year, and rent of primary residence is up 2.8 percent over the year. The shelter year of 3.2 percent is also the figure in the news-release text.
Table A’s shelter row is 0.3 percent in March, 0.6 in April, 0.3 in May, 0.1 in June, 0.1 in July, 0.3 in August, and 0.4 in September. Gasoline can account for over half of one month and still be a fuel price. Shelter is the line that keeps moving after the fuel month is over. BLS builds shelter from rents on occupied units, with a lag. A listing that changed rent on a Nature Coast street this month can still sit inside a 3.2 percent year-over-year shelter print. The national index describes the basket. The lease on a particular address describes that address.

August’s shelter print, on the August CPI page, was a 0.3 percent month and a 3.0 percent year, with owners’ equivalent rent and rent of primary residence each up 0.2 percent that month. September’s shelter month is 0.4 percent, September’s shelter year is 3.2 percent, and September’s owners’ equivalent rent month is 0.3 percent. Keep the month on the sentence.
What the September minutes record
The minutes are the Federal Reserve’s account of the meeting held Tuesday, September 15, 2026, at 10:30 a.m., and continued Wednesday, September 16, at 9:00 a.m. The September 16 statement is the decision released that afternoon. These minutes, posted October 7, are the staff review and the participants’ discussion of that same meeting.
In their consideration of policy at the meeting, all participants supported raising the target range for the federal funds rate by a quarter percentage point, to 3-3/4 to 4 percent. The Committee then voted 12–0 for that range. Voting for the action were Kevin Warsh, John C. Williams, Michael S. Barr, Michelle W. Bowman, Lisa D. Cook, Beth M. Hammack, Philip N. Jefferson, Neel Kashkari, Lorie K. Logan, Anna Paulson, Jerome H. Powell, and Christopher J. Waller. The minutes record no dissenting vote. The Board of Governors voted unanimously to raise the interest rate paid on reserve balances to 3.90 percent, effective September 17, and to raise the primary credit rate a quarter point to 4.0 percent, effective the same day.
The directive released with the statement tells the Desk to keep the federal funds rate in a target range of 3-3/4 to 4 percent, to conduct standing overnight repurchase agreement operations at 4.0 percent, and to conduct standing overnight reverse repurchase agreement operations at 3.75 percent with a per-counterparty limit of $160 billion per day. The statement the minutes reproduce says economic activity is expanding at a solid pace, that inflation remains elevated, and that the action will support a timelier return to the 2 percent goal. It includes the sentence that the Committee will deliver price stability.
Participants generally emphasized that inflation remained elevated, that the labor market appeared to be near full employment with some signs of strengthening, and that economic activity was expanding at a solid pace. Almost all participants assessed that inflation risks were tilted to the upside, and that risks to the labor market had diminished and were broadly balanced. All participants viewed the higher range as appropriate. Many participants emphasized that a higher path for the target range would be prudent on risk-management grounds, as insurance against inflation remaining persistently above target. A number of participants viewed a higher path as necessary on their modal outlooks. Some participants said a higher policy rate would diminish the risk that persistently elevated inflation would unanchor inflation expectations. Several participants stated that they viewed the current policy rate as only mildly restrictive, or short of restrictive. A couple of participants said they had increased their estimate of the neutral federal funds rate.
On the path after this meeting, most participants assessed that another increase in the target range would likely be appropriate by year-end. They also said they approached each meeting ready to decide from the incoming information and its implications for the outlook and the balance of risks. The minutes record the next meeting as Tuesday–Wednesday, October 27–28, 2026. That date is the calendar line in the October 7 file. The decision at that meeting is the statement that meeting produces.
The staff review in these minutes is the information available on September 15 and 16. Staff estimated that total PCE inflation edged up to 3.8 percent in August, and that core PCE remained at 3.4 percent in August. Under the methodology the Bureau of Economic Analysis had said it would implement at the end of September, staff estimated August total inflation at 3.6 percent and core at 3.2 percent. That is an August PCE estimate inside the minutes. The 0.6 percent and the 3.7 percent on this page are the September CPI. PCE and the CPI are two indexes. August and September are two months.
Participants said progress on lowering inflation had been insufficient in recent months. They said geopolitical developments, which had pushed up prices for crude oil and refined fuel products, and surging AI-related investment were contributing to inflation pressures. Several participants observed that core services excluding housing remained elevated, and that core goods remained elevated as the effects of the AI buildout appeared to increase while the effects of tariff increases waned. A few participants noted that software and portfolio-management fees had made relatively large contributions to recent PCE readings, and that the coming BEA methodology change would likely reduce those contributions somewhat. Participants judged that medium- and longer-term inflation expectations remained consistent with the 2 percent objective. Several participants noted that short-term inflation expectations were elevated. Participants generally expected inflation to remain elevated in the near term and then decline toward 2 percent over the medium term under appropriate policy. Many participants cited business contacts reporting increased cost pressures. Participants generally assessed inflation risk as skewed to the upside.
The labor-market paragraphs in the minutes describe conditions as stable and close to maximum employment. A majority of participants assessed that the labor market had strengthened a bit recently. Several noted unusually low dynamism: low hiring, low layoffs, a low job-finding rate, and a persistently elevated long-term unemployment rate. Some said aggregate wage growth was moderate and consistent with inflation moving toward 2 percent. The national payroll count published after this meeting is the separate September employment situation. The minutes are what the Committee had in the room on September 15 and 16.
On financial conditions, the manager said nominal Treasury yields increased around 35 basis points across the 2- to 10-year segment over the intermeeting period. Many participants said that, with that rise in longer-term yields, financial conditions still appeared supportive of economic growth, with equity prices up substantially on the year and corporate-bond spreads narrow. Several said credit appeared broadly available. The Desk had paused reserve-management purchases. The manager said reserve balances still appeared consistent with an ample supply, and that the pace of those purchases was a monthly decision aimed at keeping reserves ample.
Housing in the same minutes
A few participants commented that housing was a sector in which financial conditions were unsupportive of activity, with mortgage rates remaining at elevated levels. The staff review of markets said financing conditions were generally accommodative for larger businesses and municipalities, and somewhat restrictive for residential mortgage borrowers and small businesses. Residential mortgage rates increased a bit more than 10-year Treasury yields over the intermeeting period. Borrowing for home purchases remained depressed, and total home-equity borrowing stayed near pre-pandemic levels.
That housing paragraph is a comment in the minutes. It is a description of mortgage-market conditions as participants and staff saw them in mid-September. The weekly coupon a buyer quotes in October is a later survey. Freddie Mac’s Primary Mortgage Market Survey of October 8, 2026, is 7.40 percent on the 30-year and 6.73 percent on the 15-year, in the October 8 rate note. NAR’s September sales release, below, cites a September average 30-year of 6.86 percent from Freddie Mac. The 6.86 percent is the month of the closings. The 7.40 percent is the Thursday survey after those closings.
The October 14 Beige Book, collected on or before October 5, is the separate Sixth District housing note. Home sales in that district improved moderately, and more homes sold below the asking price, especially in Florida. The Beige Book is contacts. The minutes are the Committee. The sales count in the next section is closings.
How many existing homes sold
Existing-home sales increased 1.5 percent from August and decreased 2.2 percent from a year earlier, to a seasonally adjusted annual rate of 3.99 million in September. NAR published that report from Washington on October 13, 2026. The association’s chief economist, Lawrence Yun, said that despite the small monthly gain on a seasonally adjusted basis, August and September marked the two slowest months for home sales this year, and that further increases in mortgage rates in recent weeks mean fewer buyers can qualify. He also said higher inventory and lengthening days on market give buyers improved negotiating power, and that sellers need to be realistic about local conditions, which could require price discounts and other incentives.
The August release, as written up in the August sales snapshot, printed a 3.98 million pace. The September release prints 3.99 million, and it states a 1.5 percent increase from August. Use 3.99 million, and the 1.5 percent, when the question is the September report. Use 3.98 million when the question is the August report as it was published.
Total housing inventory in the September report reached 1.60 million units, up 1.9 percent from August and 4.6 percent from September 2025. Unsold inventory was a 4.8-month supply, unchanged from August in this release and up from 4.5 months one year ago. The August briefing printed 1.62 million homes for sale and a 4.9-month supply from the August release. The September sentences use the September release.
The median existing-home price for all housing types was $417,500, up 1.3 percent from $412,300 a year earlier. NAR calls that the 39th consecutive month of year-over-year price gains. The release says the only valid comparisons for median prices are with the same period a year earlier, because of seasonality in buying patterns. A September median against an August median is the comparison the association tells readers to skip. A September median against September 2025 is the comparison it prints.
Single-family sales increased 2.0 percent from August to an annual rate of 3.64 million, and were down 1.9 percent from September 2025. The median single-family price was $422,700, up 1.2 percent from a year earlier. Condominium and co-op sales decreased 2.8 percent from August to an annual rate of 350,000, and were down 5.4 percent from September 2025. The median condo and co-op price was $363,700, up 1.2 percent from a year earlier. The 3.64 million and the 350,000 add to the 3.99 million all-housing-types rate.
The Housing Affordability Index registered 105.4, down from 106.7 one year ago. Affordability declined over the year in the Northeast by 4.5 percent, in the Midwest by 3.1 percent, and in the South by 0.4 percent. It increased in the West by 1.0 percent.
The Realtors Confidence Index for September puts the median time on market at 33 days, up from 31 days in August and unchanged from September 2025. First-time buyers were 31 percent of sales, up from 30 percent in August and 30 percent a year earlier. Cash sales were 27 percent of transactions, unchanged from August and down from 30 percent a year earlier. Individual investors and second-home buyers were 20 percent of transactions, up from 15 percent in August and a year earlier. Distressed sales were 2 percent, unchanged from August and from a year earlier.
NAR cites Freddie Mac for the mortgage rate inside this sales release: the average 30-year fixed rate was 6.86 percent in September, up from 6.67 percent in August and 6.35 percent one year ago. That 6.86 percent is the association’s September average, attributed to Freddie Mac, in the October 13 sales report. It is a different print from the October 8 weekly survey of 7.40 percent and 6.73 percent.

The South region in the same report
Month-over-month sales increased in the South and the West, held steady in the Midwest, and declined in the Northeast. Year-over-year sales declined in all four regions. NAR’s summary of the September statistics shows the South as 47 percent of existing-home sales by region.
South sales increased 2.8 percent from August to an annual rate of 1.86 million, and were down 0.5 percent from September 2025. The South median price was $361,000, up 0.2 percent from a year earlier. Northeast sales declined 2.1 percent to an annual rate of 470,000, down 4.1 percent from a year earlier, with a median price of $523,600, up 4.7 percent. Midwest sales were unchanged at 930,000, down 2.1 percent from a year earlier, with a median of $329,600, up 3.1 percent. West sales increased 2.8 percent to 730,000, down 5.2 percent from a year earlier, with a median of $613,600, down 0.3 percent from September 2025.
Florida sits inside NAR’s South region. The 1.86 million and the $361,000 are the South. A Florida median, and a county median, are a different file. The four regional rates add to the national 3.99 million: 1.86, 0.47, 0.93, and 0.73.
A closing in this report is a completed sale reported through a multiple listing service. A contract that went pending in September and then fell through is the separate pending-sales note: 14.5 percent of September deals were canceled, and Tampa’s share was 18.8 percent. The NAR pace counts the sales that reached closing. The cancellation share counts contracts that came back to the market. A buyer reading both can see the closed pace and the share of September contracts that never became one of those closings.
What a buyer, a seller, and an owner do with the three files
For a buyer, the September CPI says the basket rose 0.6 percent, with gasoline doing over half of that month and shelter still rising 0.4 percent. The minutes say every participant supported the quarter-point increase to 3.75–4.00 percent, and that a few of them described mortgage rates as elevated enough that housing was a sector where financial conditions were unsupportive. The sales report says the national resale pace was 3.99 million, inventory was 1.60 million units and 4.8 months, the national median was $417,500, and the typical September sale took 33 days. The payment on a specific house is the written quote. The October 8 survey behind that conversation is 7.40 percent and 6.73 percent. A quote starts on the mortgage page. The September count of housing starts, and the Freddie Mac survey dated October 22, are later briefings.
The South median of $361,000 is a regional midpoint for September closings. It is the number to use when the question is NAR’s South. The house on a Citrus, Hernando, Pasco, Hillsborough, or Pinellas street still prices from current sales of similar houses, the tax bill on that parcel, and the insurance quote on that roof. First-time buyers were 31 percent of the national September closings. Cash was 27 percent. Investors and second-home buyers were 20 percent. Those shares describe the national mix in the confidence index. They describe a particular offer when the contract says so.
For a seller, Yun’s sentence in the October 13 release is the one to keep next to the list price: higher inventory and longer days on market give buyers negotiating power, and local conditions can call for a price discount or another incentive. The September report’s own inventory is 1.60 million and 4.8 months. Days on market moved from 31 in August to 33 in September. The Sixth District contacts in the October Beige Book said more homes sold below the asking price, especially in Florida, and that sellers offered discounts and incentives. A 0.6 percent CPI month is a reason the funds rate in the minutes moved up. It is a thin reason to raise a list. Price against current comps and a current lock quote.
For an owner, the shelter weight is the part of the national basket that tracks rent and owners’ equivalent rent: 35.323 percent for shelter, 25.902 percent for owners’ equivalent rent of residences. The September shelter increase is 0.4 percent on the month and 3.2 percent on the year. That is the inflation line in the CPI. The equity line in the minutes is separate: staff said home-equity borrowing stayed near pre-pandemic levels while purchase borrowing remained depressed. A refinance quote uses the October rate survey and the remaining term on the existing note. An owner who is also a seller is back in the 33-day and 4.8-month sentences.
The three numbers to keep
September CPI-U rose 0.6 percent on the month and 3.7 percent over the year. Shelter rose 0.4 percent and is up 3.2 percent over the year. Gasoline rose 9.1 percent and accounted for over half of the monthly all-items increase. Core rose 0.3 percent and 2.6 percent over the year. The September 15–16 minutes record that all participants supported a quarter-point increase, that the Committee voted 12–0 to set the funds rate at 3-3/4 to 4 percent, and that a few participants said elevated mortgage rates left housing as a sector where financial conditions were unsupportive. Existing-home sales in September ran at 3.99 million, 1.5 percent above August on NAR’s comparison and 2.2 percent below a year earlier, with a $417,500 median, 1.60 million homes for sale, and a 4.8-month supply. The South ran at 1.86 million with a $361,000 median.
Bridge Point will read a Florida address against the payment, the comps, and these three files with the month left on each figure. Call 352-515-0226 or start at contact.
Sources: U.S. Bureau of Labor Statistics, Consumer Price Index — September 2026, USDL-26-1574, October 14, 2026, 8:30 a.m. Eastern (CPI-U seasonally adjusted +0.6 percent on the month after +0.4 percent in August; +3.7 percent over twelve months before seasonal adjustment; core +0.3 percent and +2.6 percent over the year; shelter +0.4 percent and +3.2 percent over the year; owners’ equivalent rent +0.3 percent; rent of primary residence +0.2 percent; lodging away from home +2.0 percent; gasoline +9.1 percent seasonally adjusted and +6.5 percent unadjusted, accounting for over half of the monthly all-items increase, and +34.2 percent over the year; energy +5.2 percent and +20.4 percent over the year; food unchanged on the month and +2.5 percent over the year; CPI-U index 336.940; relative importance shelter 35.323, owners’ equivalent rent of residences 25.902, rent of primary residence 7.728). Federal Reserve, minutes of the Federal Open Market Committee, September 15–16, 2026, posted October 7, 2026 (12–0 vote to raise the target range to 3-3/4 to 4 percent; interest on reserve balances 3.90 percent; primary credit rate 4.0 percent; standing repo 4.0 percent; standing reverse repo 3.75 percent with a $160 billion per-counterparty limit; staff August PCE estimate 3.8 percent total and 3.4 percent core; housing comments; Treasury yields up about 35 basis points on the 2- to 10-year segment; next meeting October 27–28, 2026). National Association of Realtors, Existing-Home Sales, October 13, 2026, Washington, and the summary of September 2026 existing-home sales statistics (3.99 million seasonally adjusted annual rate, +1.5 percent month, −2.2 percent year; inventory 1.60 million, +1.9 percent from August, 4.8-month supply; median $417,500, +1.3 percent from $412,300; single-family 3.64 million and $422,700; condo and co-op 350,000 and $363,700; South 1.86 million and $361,000; Northeast 470,000 and $523,600; Midwest 930,000 and $329,600; West 730,000 and $613,600; South 47 percent of sales by region on the summary graphic; affordability index 105.4; 33 days on market; first-time buyers 31 percent; cash 27 percent; investors 20 percent; distressed 2 percent; Freddie Mac 30-year average 6.86 percent in September, as cited by NAR). Freddie Mac PMMS of October 8, 2026, is the separate weekly survey at 7.40 percent and 6.73 percent.
Questions people ask first
Quick answers to common questions about this topic.
What did the September 2026 Consumer Price Index show?
BLS reported on October 14, 2026, that the CPI-U rose 0.6 percent in September after 0.4 percent in August, and 3.7 percent over the twelve months ending September. Core CPI rose 0.3 percent on the month and 2.6 percent over the year. Gasoline rose 9.1 percent and accounted for over half of the monthly all-items increase. The release is USDL-26-1574.
How did shelter move in September?
Shelter rose 0.4 percent in September after 0.3 percent in August, and it is up 3.2 percent over the year. Owners’ equivalent rent rose 0.3 percent. Rent of primary residence rose 0.2 percent. The release’s relative-importance column prints shelter at 35.323 percent of the CPI-U and owners’ equivalent rent of residences at 25.902 percent.
What did the September FOMC minutes say about the rate decision?
The minutes of the September 15–16, 2026 meeting, posted October 7, record that all participants supported a quarter-point increase and that the Committee voted 12–0 to set the federal funds rate at 3.75 to 4.00 percent. The September 16 statement is the separate hike note. The minutes are the account of what participants and staff said.
What did participants say about housing?
A few participants said housing was a sector where financial conditions were unsupportive of activity, with mortgage rates remaining elevated. Staff said residential mortgage rates rose a bit more than 10-year Treasury yields, and that borrowing for home purchases remained depressed. The October 8 Freddie Mac survey, 7.40 percent on the 30-year, is a later weekly print.
How many existing homes sold in September 2026?
NAR reported on October 13, 2026, that existing-home sales ran at a seasonally adjusted annual rate of 3.99 million, up 1.5 percent from August and down 2.2 percent from a year earlier. Inventory was 1.60 million units, a 4.8-month supply. The median price was $417,500, up 1.3 percent from a year earlier. The August release printed about 3.98 million.
What did NAR print for the South?
South sales increased 2.8 percent from August to an annual rate of 1.86 million, and were down 0.5 percent from September 2025. The South median price was $361,000, up 0.2 percent from a year earlier. That is NAR’s South region. A Florida median and a county median belong to a different file.
Which mortgage rate belongs with these closings?
NAR cites a September average 30-year of 6.86 percent, from Freddie Mac, up from 6.67 percent in August. The weekly survey dated October 8 is 7.40 percent on the 30-year and 6.73 percent on the 15-year. The September average describes the month of the closings. The October 8 survey is the weekly print after that month.
Who can apply these three files to a Florida house?
Bridge Point Business & Real Estate Advisors reads a specific address against the payment, the comps, and these national files. Call 352-515-0226 or start at the contact page.
Talk with Bridge Point
Considering a purchase or sale in this market? Local guidance can make a meaningful difference.
Schedule a consultation
