Market Update · 5 min read
By Terry Williams, Co-founder and Managing Broker ·
Pending Home Sales October 2026: Index Falls 4.7% to 63.0 (Record Low)
63.0 was NAR's Pending Home Sales Index for October 2026, the lowest reading on record. Contract signings on existing homes fell 4.7 percent from September and 16.7 percent from October 2025, the National Association of Realtors reported November 18. All four regions declined, led by the West at 6.9 percent and the South at 6.3 percent.

63.0 was NAR's Pending Home Sales Index for October 2026, the lowest reading on record. Contract signings on existing homes fell 4.7 percent from September and 16.7 percent from October 2025, the National Association of Realtors reported November 18. All four regions declined, led by the West at 6.9 percent and the South at 6.3 percent.
The index counts signed contracts on existing single-family homes, condos, and co-ops that have not yet closed. NAR's next report, for November, is due Thursday, December 17, at 10 a.m. Eastern.
How far did pending home sales fall in October 2026?
NAR's Pending Home Sales Index fell 4.7 percent in October 2026 to 63.0, after a 7.3 percent drop in September. Year over year, contract signings were down 16.7 percent. An index of 100 equals the average contract activity of 2001, the first year NAR examined, so 63.0 is 37 percent below that baseline.
- Index level, October 2026: 63.0, the lowest on record.
- Change from September: down 4.7%.
- Change from October 2025: down 16.7%.
- September 2026, for comparison: down 7.3% from August and 11.3% from a year earlier.
NAR Chief Economist Dr. Lawrence Yun said: “Two consecutive months of record-low pending contracts point to very sluggish fourth-quarter home sales closings, and annual existing-home sales could be the lowest since the mid-1990s.”
Which regions saw the biggest drops?
Every region fell in October, both from September and from a year earlier. The West dropped the most, down 6.9 percent for the month and 20.3 percent for the year. The South fell 6.3 percent and 18.7 percent. The Midwest fell 2.7 and 14.0 percent, and the Northeast fell 0.8 and 11.1 percent.
- West: down 6.9% month over month and 20.3% year over year. In September it fell 9.2% and 15.0%.
- South: down 6.3% month over month and 18.7% year over year. In September it fell 8.2% and 12.0%.
- Midwest: down 2.7% month over month and 14.0% year over year. In September it fell 6.5% and 8.7%.
- Northeast: down 0.8% month over month and 11.1% year over year. In September it fell 4.2% and 9.4%.
The South, which includes Florida, posted the second-largest monthly and annual declines in both months. Its annual drop widened from 12.0 percent in September to 18.7 percent in October. NAR's release reports regional changes, not state figures, so it does not break out Florida.
Why did contract signings fall to a record low?
NAR tied the decline to mortgage rates. In September, Yun said conditions weakened “due to fast-rising mortgage rates.” October contracts were signed while Freddie Mac's 30-year average was 7.40 percent on October 15 and 7.24 percent on October 29. Yun now says October “could mark the low point” because rates appear to have topped out.
His full statement: “October could mark the low point in contract signings for this housing cycle, as mortgage rates appear to have topped out.” He added: “It is somewhat puzzling that home sales would fall to levels last seen three decades ago, even as the U.S. population has grown by roughly 75 million. Either sizable housing demand is building in the background, or the dream of homeownership is increasingly out of reach for many Americans.”
The 30-year average moved back up after October. The November 19 Freddie Mac survey put it at 7.28 percent, up from 7.11 percent the week before and 102 basis points above the year-ago week.
What do pending sales signal for closings?
Pending sales lead closings by one to two months, because most contracts close within that window. NAR says monthly contract activity tracks closed existing-home sales over the following two months, so October's record low points to weak November and December closings. Yun expects very sluggish fourth-quarter closings and the lowest annual sales since the mid-1990s.
Closings were already slowing. NAR's November research update put October existing-home sales down 5.5 percent from September and 8.8 percent from a year earlier. The September figure, a 3.99 million annual pace, is in the September existing-home sales briefing.
Not every pending contract closes. NAR notes that financing, inspection, and appraisal problems can stretch or end a deal. Redfin's count of September contracts that fell through, including Tampa's share, is in the September contract cancellations report.
What does this mean for Tampa Bay and Florida buyers and sellers?
Florida sits in NAR's South region, where contract signings fell 6.3 percent in October and 18.7 percent from a year earlier. NAR does not publish a Tampa Bay pending index. Among the 50 largest metros, Jacksonville, down 12.8 percent, was the only Florida market among the ten with the smallest annual declines in NAR's release.
For a buyer, fewer signed contracts across the South is a regional backdrop, not a price on a particular house. The terms still come from the house, the inspection, the appraisal, and a written lender quote at today's rates. The purchase steps are on residential buying, and a quote starts on the mortgage page.
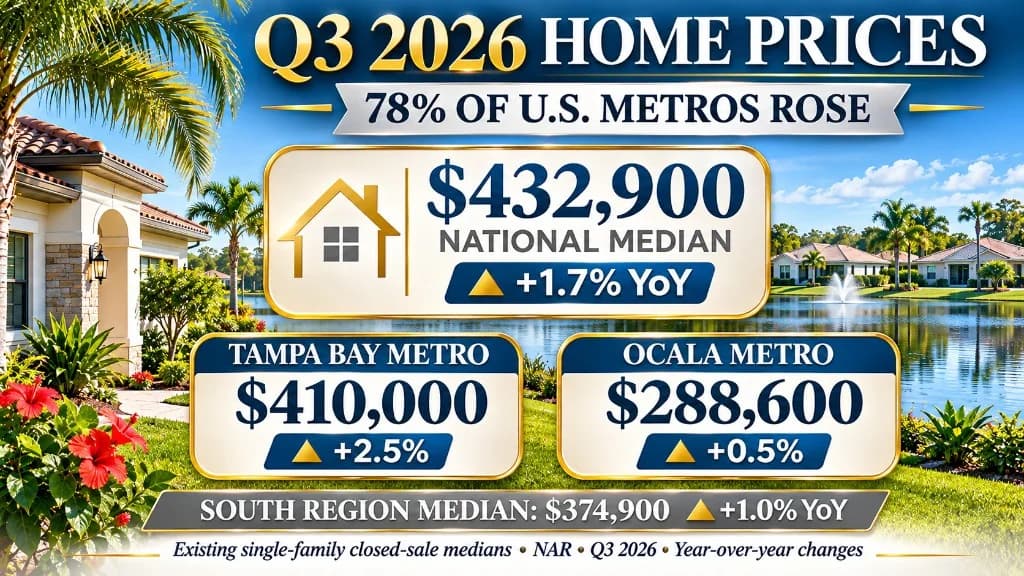
For a seller, the South's 18.7 percent annual decline in contracts means pricing from current comparable sales rather than last year's pace. NAR's third-quarter median for Tampa–St. Petersburg–Clearwater, $410,000, is in the Q3 metro home prices briefing. Listing work is on residential selling.
When is the next pending home sales report?
NAR will release November 2026 pending home sales on Thursday, December 17, 2026, at 10 a.m. Eastern. That report will show whether Yun's view that October marked the low point holds. Freddie Mac's next weekly rate survey comes out Wednesday, November 25, a day early because Thanksgiving falls on Thursday, November 26.
The Federal Open Market Committee meets December 8–9 with new economic projections. This post does not forecast either release.
Call 352-515-0226, email info@BridgePointBREA.com, or contact Bridge Point. Bring the address and any quote you already have.
*This note is general information about NAR's national and regional October 2026 pending home sales report. It is not an appraisal, a price opinion on a specific property, or lending advice.*
Sources and further reading
- Pending Home Sales Decreased 4.7% in October, According to NAR Report (November 18, 2026) — National Association of Realtors
- Pending Home Sales Snapshot — National Association of Realtors
- Pending Home Sales: data, methodology, and release schedule — National Association of Realtors
- Pending Home Sales Decreased 7.3% in September (October 20, 2026) — National Association of Realtors
- Research Update, November 2026 — National Association of Realtors
Questions people ask first
Quick answers to common questions about this topic.
What was the Pending Home Sales Index in October 2026?
NAR's Pending Home Sales Index was 63.0 in October 2026, the lowest reading on record. It fell 4.7% from September and 16.7% from October 2025. An index of 100 equals the average level of contract activity in 2001.
Did pending home sales fall in every region in October 2026?
Yes. The West fell 6.9% month over month and 20.3% year over year. The South fell 6.3% and 18.7%, the Midwest 2.7% and 14.0%, and the Northeast 0.8% and 11.1%.
What is a pending home sale?
A pending sale is a contract on an existing home that has been signed but has not closed. NAR says most close within one or two months, so the Pending Home Sales Index is an early read on closed existing-home sales.
What did NAR's chief economist say about October pending home sales?
Dr. Lawrence Yun said October could mark the low point in contract signings for this housing cycle, as mortgage rates appear to have topped out. He also said two consecutive months of record-low pending contracts point to very sluggish fourth-quarter closings.
When is the next pending home sales report?
NAR will release November 2026 pending home sales on Thursday, December 17, 2026, at 10 a.m. Eastern.
Talk with Bridge Point
Considering a purchase or sale in this market? Local guidance can make a meaningful difference.
Schedule a consultation