
How Jobs, the Beige Book, and CRE Flows Are Moving Housing and Commercial Real Estate
A September 2026 briefing on the August jobs report, the Fed Beige Book, CRE transaction volume, JOLTS, small-business optimism, office vacancies, data-center warehouse demand, multifamily supply, and foreclosure activity—and what each one does to houses and buildings.

Nine official tapes landed in the same two-week window. Together they describe a labor market that is no longer shrinking, a Fed district survey that is growing modestly, a housing market that closed August below a 4 million sales pace, and a commercial market that still looks explosive only when you leave data centers in the total.
This is a national briefing, not a Nature Coast closed-sale count. It updates the August sales snapshot after NAR’s official August print. For how the tape shows up locally, keep the Florida home buying guide, the Pasco County market overview, the Hillsborough County market overview, and the Pinellas County market overview in the same reading list.
Read every section the same way. First the official number. Then the transmission: what it does to household income, rates, rents, vacancies, and bids. Then the local implication. We will not invent a Tampa Bay median or a U.S. 19 cap rate from a national headline.
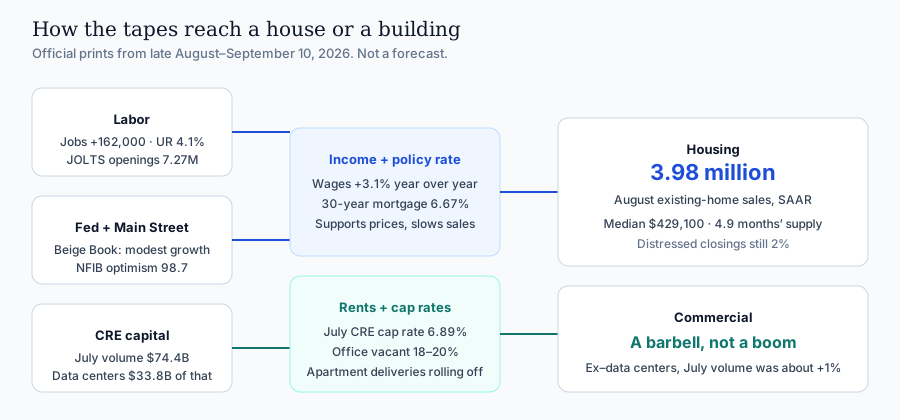
How These Indicators Move Housing and Commercial Real Estate
Housing and CRE do not trade the jobs report. They trade what the jobs report does to income, confidence, and the policy rate. A 162,000 payroll print with unemployment stuck at 4.1% keeps more households employed and more lenders underwriting. It also reduces the odds of an emergency rate cut. That combination supports prices and suppresses sales.
The Beige Book is the qualitative layer. When ten of twelve Districts report slight-to-moderate growth, residential construction is declining, and nonresidential construction is concentrated in data centers, you get a split market: fewer speculative houses, more power-hungry industrial and warehouse demand, and a Main Street that is still price-sensitive.
CRE transaction volume is the capital-markets layer. July’s $74.4 billion headline is not a bid for a Pasco flex building. Strip out $33.8 billion of data centers and the month was +1%. Liquidity is back for infrastructure and entity deals. It is not back evenly for apartments, retail, or ordinary office.
JOLTS and NFIB tell you whether employers will keep hiring and whether small tenants will keep paying rent. Office vacancy tells you whether that rent is still there in Class B and C. Multifamily supply tells you whether apartment landlords get pricing power back in 2027. Foreclosures tell you whether distress is still a rounding error or a new inventory channel. Distressed sales were 2% of existing-home closings in August. That is not 2009. It is also not zero, and Florida is one of the three highest-rate states.
The shared constraint is the cost of money. NAR put the August average 30-year fixed at 6.67%, up from 6.54% in July and 6.59% a year earlier. Cap rates on July CRE trades were 6.89%. Nobody is getting 2021 math on either side of the ledger.
August Jobs Report
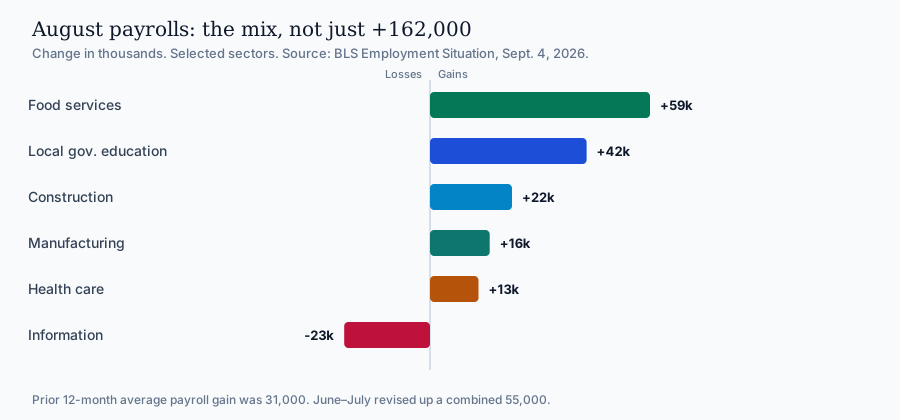
The Bureau of Labor Statistics, September 4: nonfarm payrolls +162,000 in August. Unemployment unchanged at 4.1%. Unemployed people 7.0 million. That payroll gain is well above the prior twelve-month average of 31,000 and well above the 53,000 consensus some desks had marked. June and July were revised up a combined 55,000 — June from +20,000 to +31,000, July from −23,000 to +21,000. July was not a contraction after all.
The mix matters more than the headline. Food services and drinking places added 59,000, versus a 12,000 twelve-month average. Local government education added 42,000, mostly reversing July. Manufacturing continued up +16,000 and is +58,000 since a December 2025 low. Health care added only 13,000, versus a 32,000 twelve-month average. Information lost 23,000, including computing infrastructure, data processing, and web hosting (−8,000). Construction was little changed at +22,000, with nonresidential specialty trades still drifting up.
Household-survey texture: labor-force participation 61.6%, up on the month, down 0.5 point since January. Employment-population ratio 59.1%. People working part time for economic reasons fell 414,000 to 4.4 million. Average hourly earnings $37.75, +10 cents, +3.1% year over year. The workweek edged up to 34.4 hours.
What it does to housing
Employed households buy and refinance. A 4.1% unemployment rate with wages still growing 3.1% is why NAR’s Lawrence Yun can say job creation and wage growth are supporting demand even while sales fall. It is also why prices can keep rising slowly while unit volume stalls. First-time buyers were 30% of August existing-home sales. They need a paycheck more than they need a 5% mortgage.
The sector mix is a local tell. Restaurant and local-education jobs support retail and workforce housing. A slower health-care add is a caution for medical office, not a crash. Information job losses inside computing infrastructure sit next to a data-center construction boom — more machines, fewer people in some publishing and hosting shops. Construction employment that is only “little changed” matches the Beige Book’s split: residential building down, data-center and defense work up.
The policy transmission is the other half. A 162,000 print with a stable unemployment rate is the opposite of a weakening-labor excuse for a cut. Some desks raised the odds of a September hike after the release. Higher-for-longer mortgage rates are how a “good” jobs report can still produce a 3.98 million existing-home sales pace.
What it does to commercial real estate
Office-using employment is not the engine. Information shed jobs. Professional and business services were little changed. That is consistent with Newmark’s mid-year note that office-using employment was roughly flat. Occupiers can still upgrade space. They are not filling empty floors with new headcount.
Food-service hiring supports neighborhood retail and some hospitality. Manufacturing’s grind higher supports industrial and flex. Nonresidential specialty trades support the data-center and defense bid the Beige Book keeps naming. A Pasco medical or retail pad still underwrites to the local tenant, not to a national payroll print. Continue in the Pasco commercial overview and the Hillsborough commercial overview.
Fed Beige Book: Summary of Economic Activity
The Federal Reserve’s Beige Book dated September 2, 2026, covering late July and August: economic activity increased modestly. Ten of twelve Districts reported growth in the slight-to-moderate range. Two reported no change. Consumer spending grew slightly, split between price-sensitive households and solid high-end purchases. Auto sales were subdued. Tourism increased. Manufacturing picked up, with several Districts citing defense and data-center orders. Services rose slightly to modestly. Loan volumes were solid or up. Residential construction declined. Nonresidential construction increased, often concentrated in data-center projects. Agriculture was slightly better but still strained. The outlook was positive; sentiment was mixed. Contacts flagged energy prices, policy, and international conflict.
Prices increased moderately in eight Districts. Input costs were elevated in manufacturing and construction — energy, transportation, metals. Consumer-facing firms in a few Districts said they could not pass those costs through.
Atlanta, the Sixth District that includes Florida, grew at a modest pace. Employment was unchanged on balance. Wages grew by low single digits. Home sales improved modestly, driven by discounts and incentives. Elevated mortgage rates and weaker affordability still weighed on sentiment. Entry-level demand was constrained. Luxury showed signs of softening. Mid-tier did slightly better. Speculative inventories continued to moderate. Builders expect incentives into the slower season.
Sixth District CRE expanded, with most segments reporting moderate growth. Class A office demand outpaced supply. Atlanta contacts noted conversions of underperforming Class B and C office to multifamily. Multifamily vacancies improved slightly, still supported by concessions. Retail vacancies fell, concentrated in value-oriented brands. Industrial saw rapid absorption of new inventory, focused in the data-center space.
What it does to housing
National residential construction declining while the South still needs incentives is the builder tape Florida already knows. More listings, more price cuts, more buydowns — not a 2021 model-home weekend. NAR’s August South sales were 1.84 million, −1.6% month over month, unchanged year over year. Median South price $366,500, +0.7%. That is a flat unit market with a barely rising price. It is the regional backdrop for Pasco, Hernando, Citrus, Hillsborough, and Pinellas.
The Atlanta split — weak entry-level, softer luxury, slightly better mid-tier — is a pricing instruction. Do not use a luxury incentive to set a mid-tier resale. Do not use a mid-tier closing to set an entry-level payment that the buyer cannot qualify for.
What it does to commercial real estate
The Beige Book is saying the quiet part: growth is real, and it is narrow. Data centers and defense are pulling manufacturing, trucking, nonresidential construction, and industrial absorption. Ordinary retail lives on a price-sensitive consumer. Ordinary office lives on a flight-to-quality bid, not a headcount boom. If you own Class B office, the Atlanta conversion note is the residual-value story. If you own industrial near power, the absorption note is the bid. If you own a U.S. 19 shop, the value-retail note is closer to your tenant than a $74 billion national sales month. See the U.S. 19 commercial guide.
CRE Transaction Volume
Official August 2026 MSCI/RCA volume is not out as of this briefing. July is the last full month. MSCI recorded $74.4 billion of U.S. commercial sales in July, the strongest July since 2005, +78% year over year. Trailing-twelve-month volume: $654 billion, +34%. Colliers’ read of the same tape: traditional-sector July volume $36.3 billion, −1% year over year. Ex-data centers, July was about +1%.
July sector tape:
- Data centers: $33.8 billion, nearly half the month, +1,911% year over year — dominated by the BlackRock GIP / MGX Aligned Data Centers transaction (about $40 billion enterprise)
- Portfolio / entity deals: +376%
- Hotels: +61%
- Senior housing: +55%
- Urban office: +48%
- Suburban office: +28%
- Industrial: flat, about $9 billion
- Apartments: −16%
- Retail: −13%
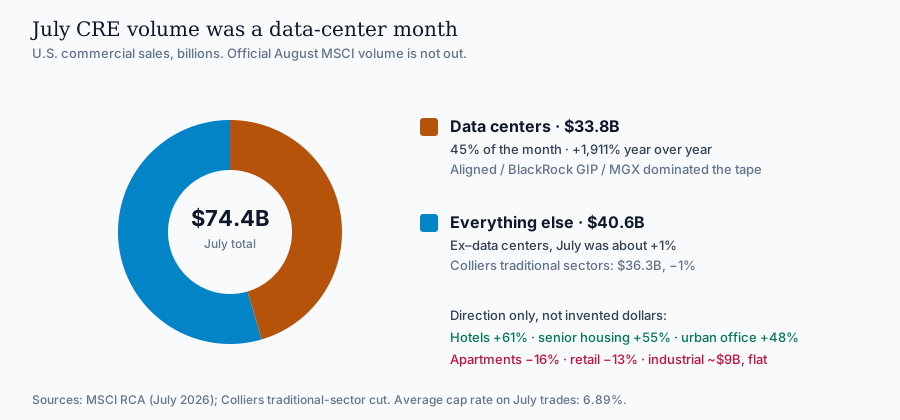
Average cap rate on July trades: 6.89%, +6 basis points from June. First-half 2026 (Avison Young / MSCI): $233.6 billion, +14.7% versus first-half 2025. Second quarter: $136.6 billion, +14%. RCA CPPI all-property prices were only about +0.2% to +0.9% year over year depending on the mid-year cut. Volume can rise while values barely move.
What it does to housing
CRE volume does not convert one-for-one into home sales. It does convert into land competition, construction-labor competition, and a wealth effect for anyone who sold a building. A data-center entity deal does not set a Wesley Chapel list price. A −16% apartment sales month does set the bid for garden-style communities and, indirectly, the rent math that competes with a first-time purchase.
What it does to commercial real estate
Liquidity is selective. Infrastructure and hotels can trade. Apartments and retail are still working through a higher-rate, higher-supply hangover. Office volume is bouncing off the bottom, not returning to 2019. August will not look like July unless another mega data-center or take-private prints. Price the corridor you have. The Westshore commercial guide and the downtown New Port Richey commercial guide are local files. They are not Aligned Data Centers.
Job Openings and Labor Turnover
JOLTS for July 2026, published September 1. August JOLTS is due September 29.
- Job openings: 7.271 million, little changed; rate 4.4% (June 7.182 million / 4.3%; July 2025 7.089 million / 4.3%)
- Hires: 5.054 million, rate 3.2%
- Total separations: 5.072 million
- Quits: 3.056 million, rate 1.9%
- Layoffs and discharges: about 1.67 million, little changed
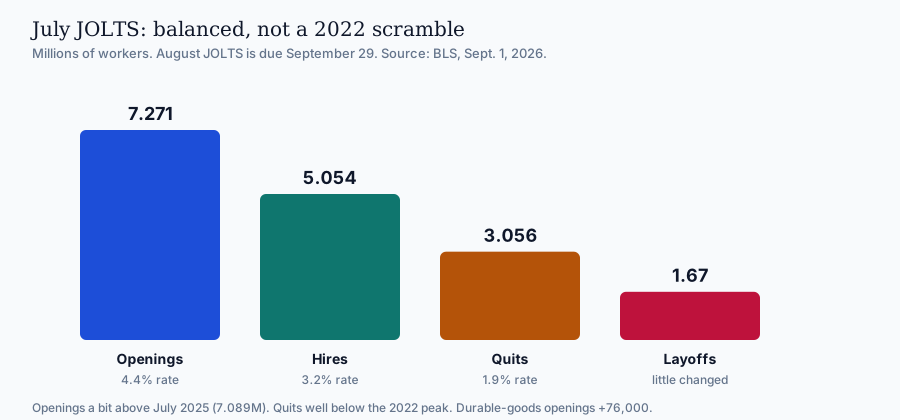
Durable-goods manufacturing openings rose 76,000. That is the Beige Book manufacturing/data-center/defense story in a single line. The rest of the report is a balanced labor market: openings a bit above last year, quits well below the 2022 scramble, layoffs not spiking.
What it does to housing
A 1.9% quits rate means fewer people are walking into a raise-and-a-move the way they did when openings were above 11 million. Household formation still happens. It happens more slowly. Combined with a 6.67% mortgage, that is how you get 3.98 million existing sales and a 4.9-month supply instead of a bidding-war spring. Openings near 7.3 million are still enough to keep unemployment at 4.1%. They are not enough to re-ignite 2021 relocation demand.
What it does to commercial real estate
Tenants hire into space they already have before they take more space. A stable openings rate with flat office-using employment is why office recovery is a quality story, not a square-footage story. Manufacturing openings are why industrial and flex in power-adjacent markets can tighten even while traditional warehouse absorption is only “rapid” where the tenant is a data-center vendor. See the industrial and flex guide.
Small Business Optimism
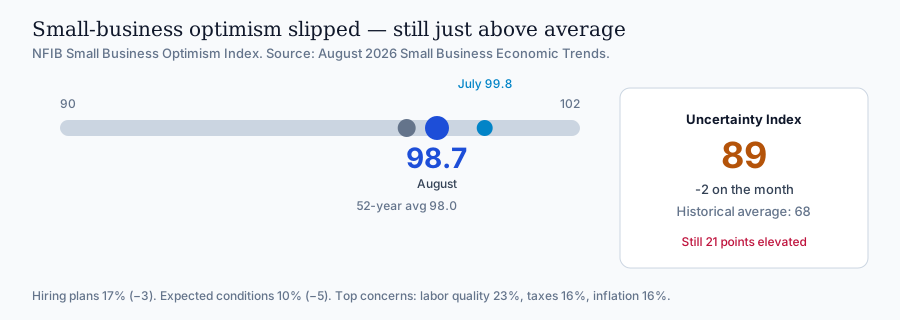
NFIB Small Business Optimism Index, August 2026: 98.7, down 1.1 from July’s 99.8 (July was the highest since August 2025). The index is still above its 52-year average of 98.0. Uncertainty Index: 89, down 2 points, still 21 points above the historical average of 68.
Six of ten components fell. Expected business conditions dropped 5 points to 10%, the lowest since May. Hiring plans fell 3 points to 17%. Earnings trends fell 3 points to −19%. Expected real sales fell 1 point to 6%. Plans to expand were unchanged at 12%. Firms raising average selling prices held at 31%, the lowest since April. Top concerns: labor quality 23%, taxes 16%, inflation 16%.
What it does to housing
Small-business owners are a large share of local homebuyers in Nature Coast and mid-Florida markets — and a large share of landlords of the second house. An optimism reading just above average, with uncertainty still elevated, is a “hold the second property, don’t stretch for the third” tape. Hiring-plan softness is also a household-income caution for anyone whose spouse works at a 20-person firm.
What it does to commercial real estate
Main Street tenants are the rent roll on U.S. 19, downtown New Port Richey, and a lot of in-town retail. When owners say they cannot pass through prices, and 31% are still raising them, you get a tenant who renews smaller or delays the expansion. That is not a wave of vacancies. It is slower absorption and more concession conversations on ordinary retail and small office. It is also why value retail — the Atlanta Beige Book’s brighter note — is the occupier that can still grow.
Office Market Vacancies
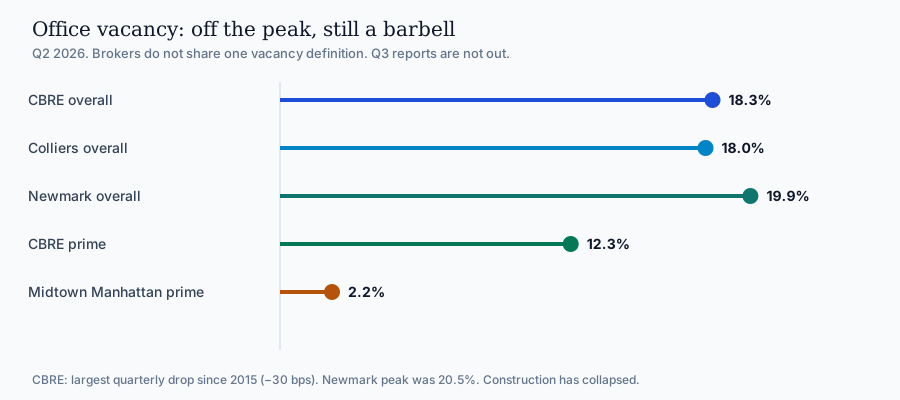
Q2 2026 is the last full national quarter. Brokers do not use one vacancy number.
- CBRE: overall vacancy 18.3%, −30 basis points on the quarter, the largest quarterly decline since 2015. Prime vacancy 12.3% (−40 bps). Midtown Manhattan prime 2.2%. Leasing 62.4 million square feet, +16% year over year.
- Colliers: vacancy 18.0%, −20 bps quarter, −50 bps year. Class A 20.8%. Net absorption 16.9 million square feet in Q2, eighth straight positive quarter. Pipeline 22.8 million square feet, versus 158 million at the end of 2019.
- Newmark: vacancy 19.9%, −60 bps year over year from a 20.5% peak. Absorption 8.8 million square feet. Construction 16.3 million square feet, about 85% below the early-2020 peak. Office-using employment roughly flat.
The disagreement is methodology. The agreement is direction: vacancy is off the peak, the drop is fastest in prime space, and new construction has collapsed. Flight to quality is the phrase every District and every broker is using. Atlanta contacts said Class A demand outpaced supply and that B/C conversions to multifamily are underway.
What it does to housing
Office vacancy does not set a house price. Office-using job growth does. Flat office employment plus a 6.67% mortgage is why relocation demand into Westchase, New Tampa, and East Lake is a commute story, not a hiring-spree story. Conversions of B/C office to apartments add future housing supply in urban cores. That is a 2027–2028 Tampa story more than a Nature Coast story.
What it does to commercial real estate
Prime office can lease and, in some CBDs, can trade. Commodity suburban office is still a residual, a conversion, or a discount. A +48% urban-office sales print in July is consistent with that barbell. Do not use a Midtown vacancy rate to underwrite a west-Pasco professional building. Do not use a 19.9% national vacancy to ignore a leased Class A tower. Underwrite the tenant, the floor plate, and the capex.
Data Centers Drive New Warehouse Demand
The July CRE tape already showed data centers as half the month. The industrial follow-on is the part that lasts after the entity deal closes.
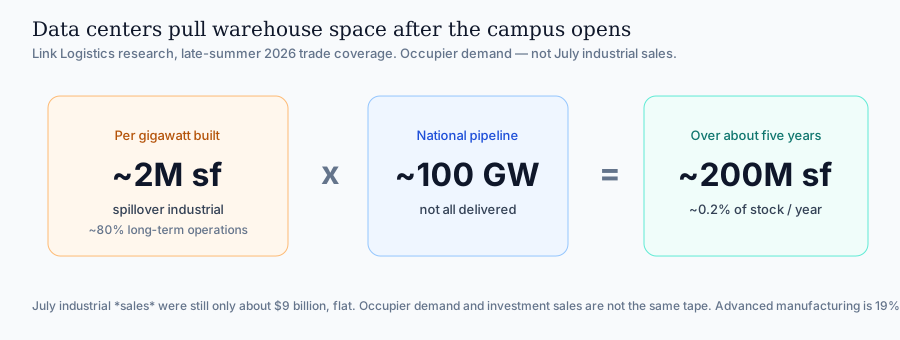
Link Logistics research, circulated in late-summer trade coverage: every gigawatt of data-center construction generates about 2 million square feet of spillover industrial demand. Roughly 80% of that is long-term operations — cooling, power, server testing, reverse logistics — not construction staging. With about 100 gigawatts in the national pipeline, that implies on the order of 200 million square feet of industrial demand over five years, or about 0.2% of stock per year. Construction-phase leases run one to three years and sit near the site. The durable bid is the vendor ecosystem.
Morgan Stanley / JLL notes cited in September coverage: advanced manufacturing is 19% of active U.S. industrial requirements, with manufacturing requirement square footage compounding more than 40% a year since 2020. Texas, Georgia, Arizona, and Ohio lead. Traditional warehouse construction has pulled back hard — new industrial starts far below the pandemic peak — so incremental data-center and manufacturing demand can tighten availability in already-lean markets. Atlanta’s Beige Book line was blunt: industrial absorption of new inventory was focused in the data-center space.
July industrial *sales* were still only about $9 billion, flat year over year. Occupier demand and investment sales are not the same tape.
What it does to housing
Data-center campuses pull construction labor, raise temporary housing demand, and can bid up land and power in the host county. They do not automatically raise a ranch five miles away. Where they do show up in housing is through construction wages, hotel and rental demand during the build, and, later, a smaller permanent operations staff. Treat that as a local due-diligence item, not a national price forecast.
What it does to commercial real estate
This is the industrial re-rating. Power-adjacent land, high-clear buildings near a campus, and vendor warehouses in Atlanta, Dallas, Phoenix, and Columbus are a different bid than a 1980s U.S. 19 warehouse. Florida’s data-center map is thinner than Virginia or North Texas, but the same vendor logic applies wherever a campus actually gets power. Traditional big-box that is not in that ecosystem still underwrites to e-commerce and regional distribution. See the Port / I-4 industrial guide and the Pasco industrial and flex guide.
Multifamily Supply Outlook
The 2023–2025 delivery wave is rolling off. The next question is how far completions fall, and whether starts have already turned.
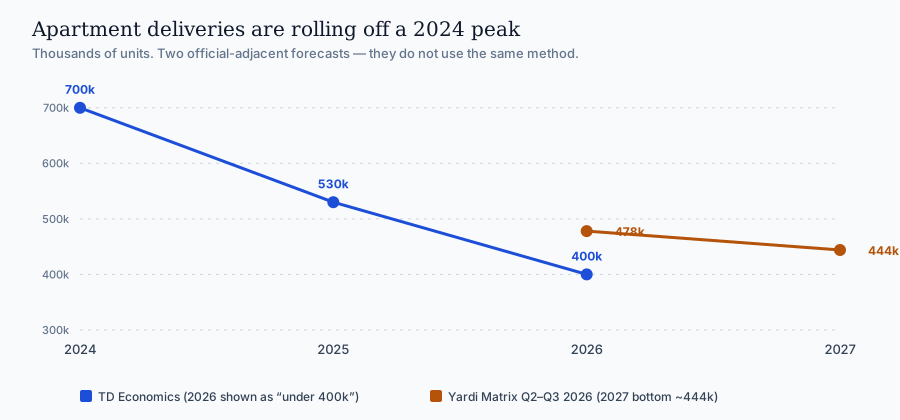
TD Economics, mid-2026: units under construction are down from just under 1.2 million in mid-2023 (about 6% of inventory) to just under 600,000 (about 2.8% of stock). Annual net deliveries peaked near 700,000 in 2024, fell to about 530,000 in 2025, and are expected under 400,000 this year. Starts have risen more than 25% since the trough, with a typical large-project lag near 19 months, so completions may pick up moderately around the turn of 2027. TD still has vacancy drifting a bit higher into late 2026 and early 2027 before easing.
Yardi Matrix Q2 2026 forecast: 478,239 completions in 2026 and 443,051 in 2027. The Q3 2026 update raised 2026 completions 2.5% and put the cycle bottom in 2027 around 444,000 units, with only a modest rebound toward about 460,000 by 2031. Yardi does not expect a return to 2024–2025 delivery levels. Market-rate supply in 2027 is expected to run below 2020; affordable deliveries are expected to run above it. Single-family rental starts were depressed into early 2026, which implies fewer SFR completions in 2027–2028.
July apartment *sales* were −16% year over year. That is capital, not completions. Landlords can face a still-heavy 2026 delivery calendar and a thinner 2027 calendar at the same time that buyers of apartment buildings stay selective.
What it does to housing
More apartments competing for renters is why some Sun Belt tenants can still negotiate, and why some would-be first-time buyers stay in a concession-heavy lease instead of buying at 6.67%. As 2027 deliveries bottom, that safety valve narrows. For-sale housing does not automatically recapture those households if mortgage rates stay here. It does mean fewer brand-new leases stealing demand from 2018-built garden product — and from entry-level resales in Wesley Chapel, Riverview, and New Tampa.
Atlanta’s Beige Book said multifamily vacancies improved slightly, still on concessions, with some office-to-apartment conversions in the pipeline. That is more urban Tampa than Nature Coast. Do not import a Midtown conversion into a Hudson rent roll.
What it does to commercial real estate
A 2027 supply bottom is the stabilization case for apartment NOI — not a rent boom. TD’s view is low-single-digit rent growth, not a snapback. Combined with −16% July sales, that is a hold-and-operate tape for many sponsors and a picky bid for anyone who has to refinance. Underwrite concessions burning off slowly, not disappearing.
Foreclosure Activity
ATTOM’s July 2026 report (August 27). August official foreclosure counts are not out.
- Properties with a filing (default, auction, or REO): 39,906, +1% from June, +10% from July 2025
- Starts: 26,648, +2% month, +10% year
- Completed REOs: 4,764, flat month, +23% year
- National rate: one filing per 3,603 housing units (0.03%)
Highest July rates: Nevada (1 in 1,703), South Carolina (1 in 2,085), Florida (1 in 2,232) — 4,596 filings, −5.7% from June, +10.3% from July 2025. Florida had 3,277 starts, second only to Texas. First-half 2026 filings: 227,548, +21% from the first half of 2025. ATTOM’s CEO, Rob Barber: activity is up, and still low by historical standards.
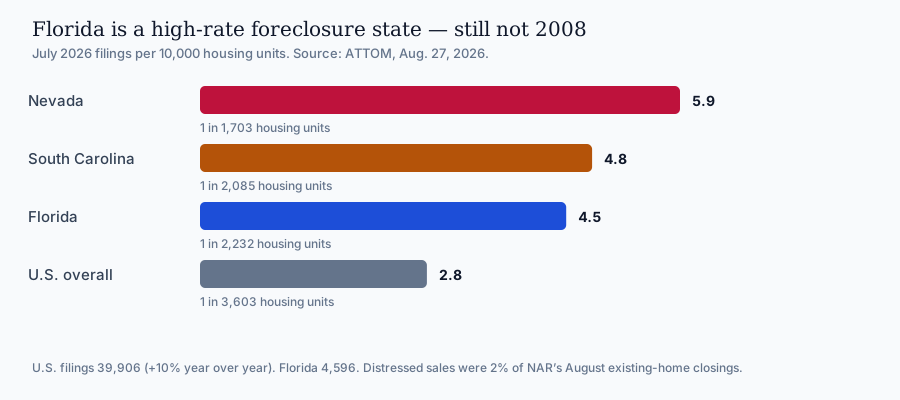
NAR’s August existing-home survey: 2% of closings were distressed (foreclosures and short sales), unchanged from July and from August 2025. That is the housing-market translation. Filings can rise 10% and still be a rounding error on the closed-sale tape.
What it does to housing
A 10% year-over-year rise in filings, with Florida in the top three rates, is a watch item — especially for insurance-stressed and payment-shocked owners. It is not a 2008 inventory wave. Two percent distressed share means the comps are still mostly voluntary sales. Do not price a listing as if REO is about to clear the neighborhood. Do inspect the few that do print. Insurance and taxes remain the Florida-specific pressure that a national 4.1% unemployment rate does not capture. Use the process in our Pasco flood and insurance guide.
What it does to commercial real estate
Residential foreclosure is not CRE distress. The CRE cousin is maturity, cap-rate, and occupancy risk on office and, in some metros, multifamily. Those show up in special servicing and discounted trades, not in ATTOM’s housing file. Watch office B/C and oversupplied apartment vintages. Do not conflate a Florida foreclosure-rate rank with a collapsing commercial bid.
The Housing Scoreboard, Updated
NAR, September 10 — official August 2026 existing-home sales, the print the August snapshot was waiting for:
- Sales: 3.98 million SAAR, −2.0% month, −1.2% year — first print below 4.0 million since June 2025
- Inventory: 1.62 million, +3.2% month, +5.9% year — first time above 1.6 million since November 2019
- Supply: 4.9 months, up from 4.6 in July and August 2025 — NAR called it the highest in over ten years
- Median price: $429,100, +1.6% year (38th straight annual increase)
- Days on market: 31
- First-time buyers: 30%; cash: 27%; investors/second homes: 15%; distressed: 2%
- South: 1.84 million, −1.6% month, unchanged year; median $366,500, +0.7%
- August 30-year mortgage (Freddie Mac, NAR’s monthly average): 6.67%
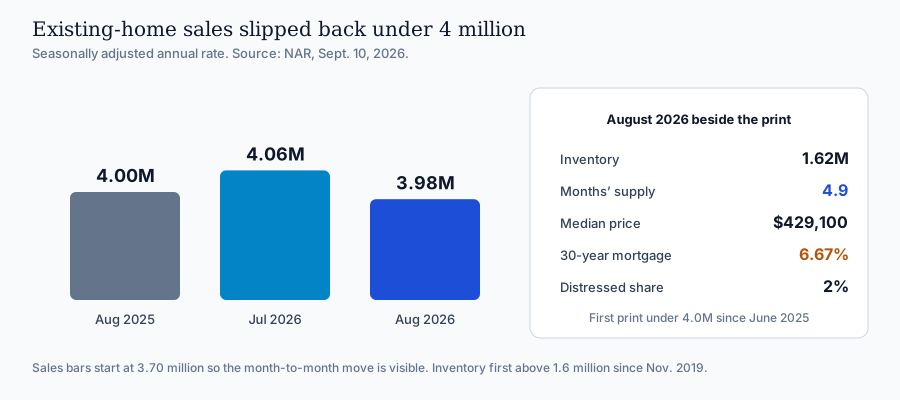
That is the residential through-line. Jobs are good enough to hold prices up 1.6%. Rates are high enough to hold sales under 4 million. Inventory is finally high enough that buyers can negotiate. The pricing strategy guide is the local next step, not a national median.
The Through-Line
Labor is stable-to-firmer. Policy is not easing. Housing is a high-rate, high-inventory, slow-sale market with prices still edging up. Commercial is a barbell: data centers, defense, prime office, and hotels on one side; apartments, retail, and commodity office on the other. Small-business owners are a little less optimistic than July and still more uncertain than normal. Foreclosures are up and still small.
For a Florida buyer: more listings, more days, more room to negotiate than in 2024 — especially in the South — and no rate gift. For a Florida seller: price to August comps, not to last summer’s ask. For a CRE owner: your bid is your sector. A $74 billion July is not a U.S. 19 cap rate.
Bridge Point’s residential buying, home selling, buying commercial, and selling commercial pages are the service layer when you want a property-level read.
What to Watch Next
- September 15–16: FOMC. The jobs print and Beige Book are already in the book.
- September 17: August housing starts and permits.
- September 25 area: Census new-home sales.
- September 29: August JOLTS.
- Second half of September: MSCI August CRE volume. If it prints anywhere near $74 billion without another data-center whale, the recovery is broader than July.
- Late September / early October: ATTOM August foreclosures; CBRE/others Q3 office.
Sources: BLS Employment Situation (August 2026, Sept. 4); BLS JOLTS (July 2026, Sept. 1); Federal Reserve Beige Book (Sept. 2, 2026), including Atlanta; NAR Existing-Home Sales (August 2026, Sept. 10); Freddie Mac via NAR; NFIB Small Business Economic Trends (August 2026); MSCI RCA / Bisnow / The Real Deal / Colliers (July 2026 CRE); CBRE, Colliers, and Newmark Q2 2026 office; Link Logistics / CPE and Morgan Stanley–JLL industrial notes; TD Economics and Yardi Matrix multifamily supply (Q2–Q3 2026); ATTOM July 2026 Foreclosure Market Report.
For help reading this tape against a specific house, storefront, or building in Hernando, Citrus, Pasco, Hillsborough, or Pinellas County, contact Bridge Point Business & Real Estate Advisors at 352-515-0226 or request a consultation.
Frequently Asked Questions
Quick answers to common questions about this topic.
Talk with Bridge Point
Considering a purchase or sale in this market? Local guidance can make a meaningful difference.
Schedule a Consultation
